The purchase order cleared customs last week, the Shopify orders are already shipping, and the Amazon dashboard shows a healthy margin on a $40 listing. The spreadsheet that produced that margin still uses the factory quote. Freight, duty, and the broker invoice are sitting in a downloads folder, unallocated, while two SKUs from the same container are priced as if they cost the same to land. A cost of goods sold calculator in Excel only earns its keep when those inbound dollars land on the right units, and when marketplace fees stay out of product cost.
The COGS Formula and Columns Your Workbook Needs
The sheet has to reproduce one equation. Beginning inventory plus purchases and other allowable acquisition costs, minus ending inventory, equals cost of goods sold. The IRS Publication 334 frames cost of goods sold this way for U.S. businesses that sell goods, because inventory must be valued at the start and the end of the year. A column that only multiplies units sold by a unit price skips that movement. Goods still on the shelf get expensed too early, and next month's opening balance has nothing honest to roll forward from.
Put the summary on its own tab. Cells B2 through B5 hold the four inputs, and B6 holds =B2+B3+B4-B5. With the example values below, that cell returns 140000.
| Input | What to enter | Example |
|---|---|---|
| Opening inventory | Cost value of stock at the start of the period | $40,000 |
| Purchases | Invoice cost of goods received in the period | $125,000 |
| Additional acquisition costs | Freight, duty, insurance and broker fees | $10,000 |
| Closing inventory | Counted cost value at the end of the period | $35,000 |
| COGS (formula cell) | Opening + Purchases + Additional costs − Closing | $140,000 |
Opening inventory is last period's closing value, pasted as a number, not linked to a live price list. Closing inventory comes from a physical count or the system quantity report, valued at the same landed cost the ledger uses. Additional acquisition costs stay in their own column. Folding freight into the supplier invoice hides which bill moved the total, and it makes a later variance impossible to trace. Which costs belong in that column, and which are operating expenses, is the split covered in a guide to landed cost versus COGS. UK sellers sorting the same line between stock and overhead can cross-check categories in Snyp's guide to UK expenses.
The first test
Change one input by $1,000. COGS must move by $1,000 in the same direction for opening inventory, purchases, and additional costs, and in the opposite direction for closing inventory. If it doesn't, a hard-coded number is sitting where the formula should be.
How to Build the Purchase Ledger Step by Step
The summary formula is only as good as the receipts underneath it. IAS 2 defines inventory cost as purchase, conversion, and other costs required to bring inventory to its present location and condition, so a factory unit price alone understates imported goods. Build the ledger as an auditable schedule, one row per SKU per receipt.
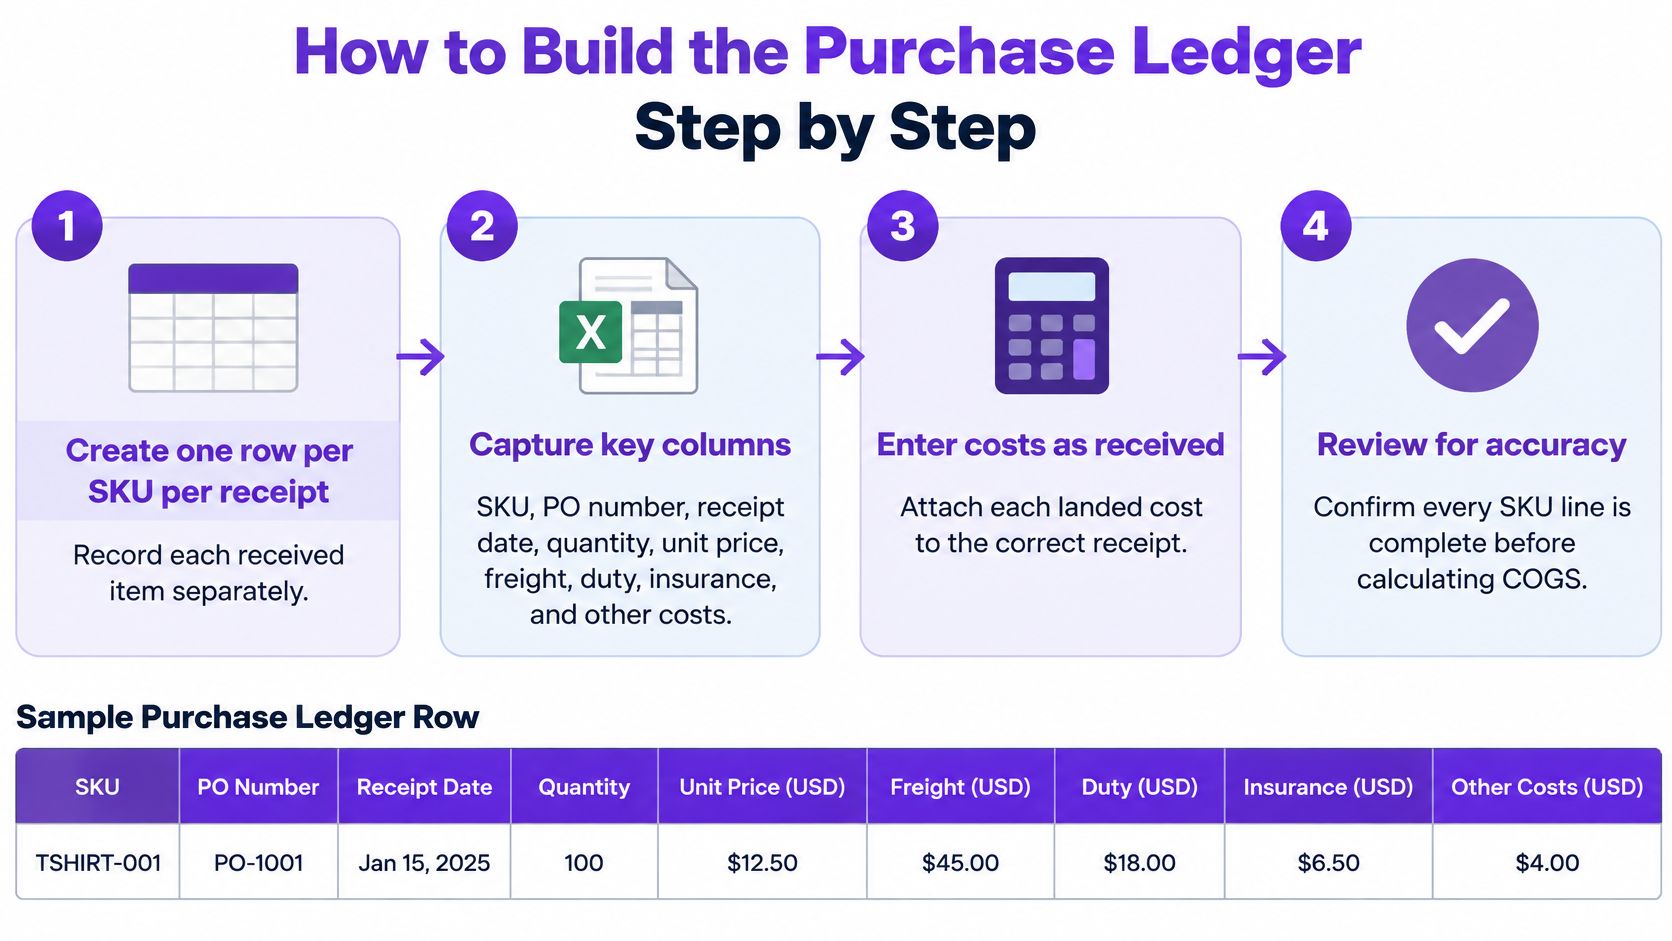
Use columns A through I for SKU, PO number, receipt date, quantity, unit price, freight, duty, insurance, and other costs. Extended cost in J is =D2*E2+SUM(F2:I2). Landed unit cost in K is =J2/D2. Period average cost for that SKU is =SUMIFS(J:J,A:A,A2)/SUMIFS(D:D,A:A,A2).
- List every receipt line from the PO, not the original quote. Suppliers revise quantities after the quote. Copying the quote double-counts a line the factory already cancelled, and duplicate PO lines inflate receipts.
- Calculate extended cost on the row. Quantity times unit price, plus the costs allocated to that line. Leaving freight in a notes cell means the SUMIFS never sees it.
- Divide the line total by quantity. That quotient is the landed unit cost you price and reorder against. Mixing currencies without a conversion rate on the row distorts it.
- Reconcile quantity. Beginning units plus receipts minus units sold must equal the physical or system ending quantity. A non-zero difference means a receipt or a sale is missing.
- Pick one cost-flow method and stick to it. Average cost smooths shipment price changes. First-in, first-out assigns the oldest receipt first. Applying average cost to one SKU and FIFO to the next makes the summary un-auditable.
- Post COGS and ending inventory to the summary tab. The income-statement figure and the balance-sheet figure come from this ledger, not from a second, unofficial calculator.
Control cells before you trust the total
Flag negative inventory, blank landed-cost fields, and duplicate PO-and-SKU pairs with conditional formatting. The quantity reconciliation cell must read zero before the summary is used for pricing. Lock the formula columns, and keep supplier invoices filed so a later edit can be traced, which is easier when you organize supplier invoices the same way the ledger is ordered. Selling costs, abnormal waste, storage that doesn't help production, and recoverable taxes stay off these rows. Snapshot the month as values so a supplier price edit next quarter can't rewrite history.
Allocating Freight, Duty and Fees to Each SKU
A mixed container is where most cost of goods sold calculator Excel files go commercially wrong while staying mathematically tidy. IRS Publication 334 treats purchased merchandise as invoice cost plus transportation and other acquisition costs, and inventory cost includes freight-in. The open question is how to split one ocean bill, one duty entry, and one broker invoice across bulky low-value units and compact high-value units on the same PO. Splitting by unit count gives every piece the same freight. The bulky SKU looks more profitable than it is, and ad spend follows that false margin.
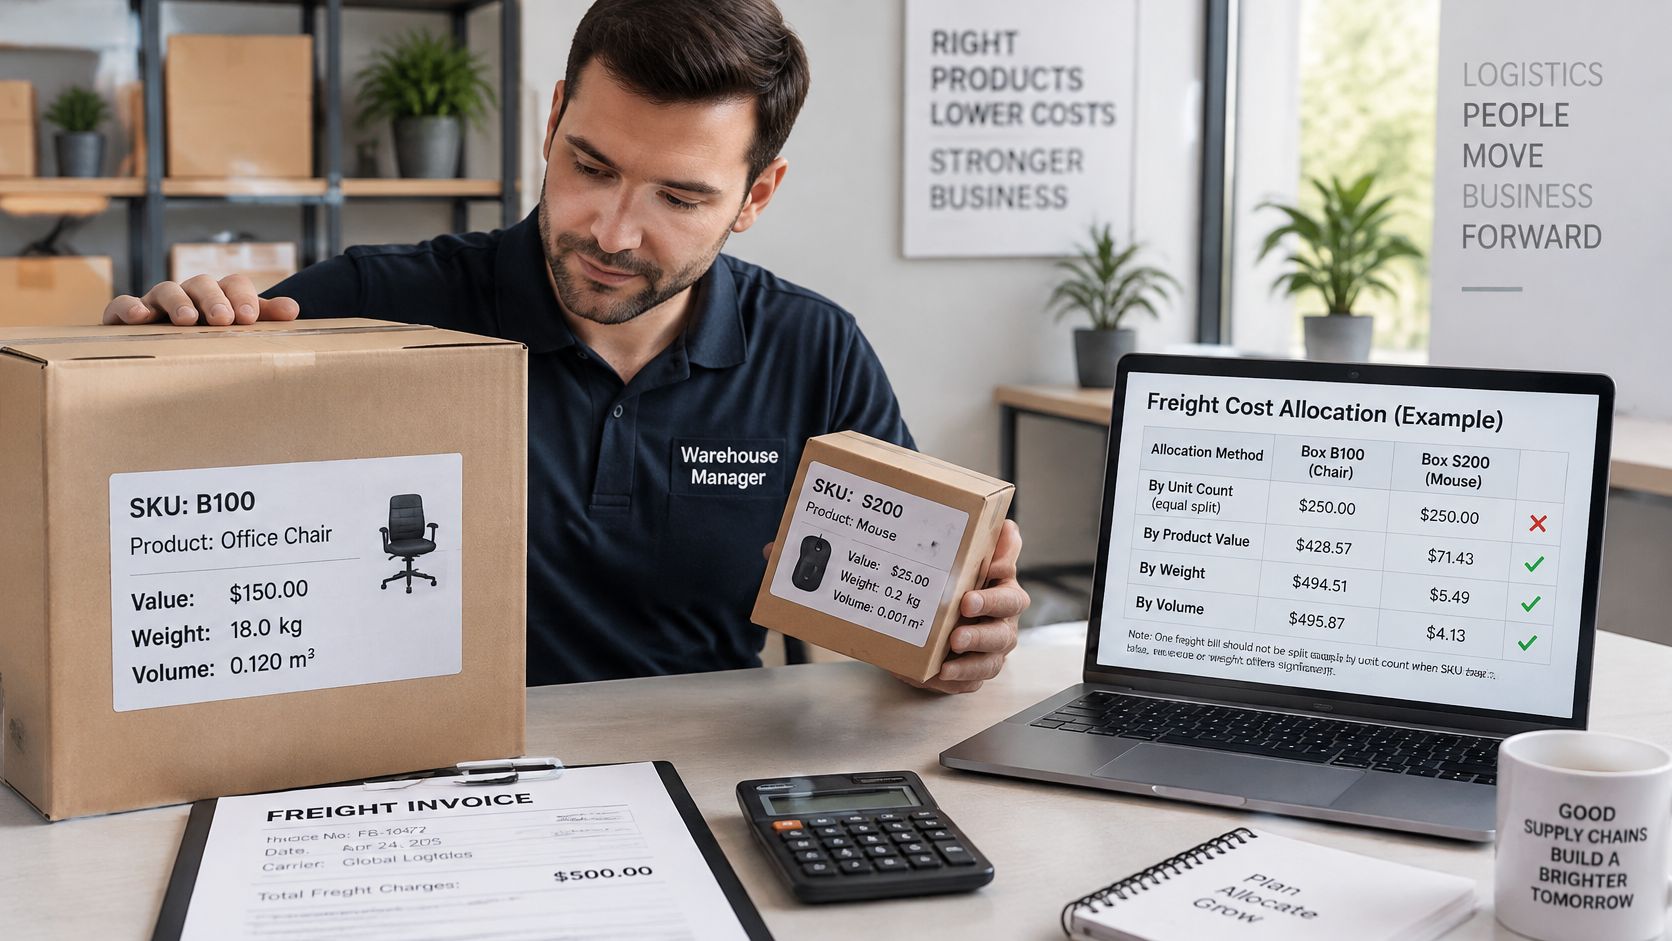
Landed cost combines factory price, freight, duty, and other import costs into one per-unit number that is recalculated as each bill arrives. Before the PO is placed, the free Landed Cost Calculator from Supply Automate calculates the true cost per unit so the allocation sheet has a target to beat.
| Method | Allocation basis | Best for | Example |
|---|---|---|---|
| Product value | Share of invoice value | Compact, high-value items and duty | A SKU at 40% of invoice value carries 40% of the duty |
| Weight | Share of gross kilograms | Dense goods and ocean freight by weight | An SKU at 30% of total kg carries 30% of freight |
| Volume | Share of cubic metres | Bulky, low-value items | An SKU at 25% of total cubic metres carries 25% of ocean freight |
| Carton count | Share of cartons | Mixed packs of similar carton size | A SKU in 8 of 40 cartons carries 20% of the carton fee |
| Hybrid | Weighted mix of two bases | Mixed POs with both bulky and dense SKUs | 50% volume plus 50% value |
A workable split
Use weight or volume for ocean freight, carton count only when cartons are close in size, and product value for duty, because duty is charged on customs value. For U.S.-bound shipments, duty rates come from the U.S. HTS schedule. The free Import Duty Calculator only answers for those shipments, because it looks up rates against that schedule. A practical walk-through of the sheet math is in this guide to allocating freight cost across multiple SKUs.
Enter the freight total on the PO sheet. Compute each SKU's share of the chosen basis, multiply that share by the total, then divide by units. Keep an estimate column and an actual column. When the carrier invoice replaces the quote, post the difference as a variance. Don't overwrite the estimate that was used for goods already sold. Cutting the bill before it is allocated still matters. Lower-cost freight strategies are worth reading before the next booking, because a smaller freight total is easier to allocate fairly than a bloated one.
Sanity test: Under a volume basis, a bulky SKU must carry more freight per unit than it would under a unit-count split. If the two results match, the allocation column is pointing at quantity, not cubic metres.
The short walk-through below shows the same idea on a single receipt, from factory line to per-unit cost.
Worked Example for One Imported SKU
Say a Shopify brand receives 1,000 units at $12. Product cost is $12,000. Freight, duty, insurance, and handling add $2,000, so the landed total is $14,000 and landed unit cost is $14. In the ledger, quantity is 1,000, unit price is 12, and additional costs sum to 2,000. Landed unit cost is =(D2*E2+F2)/D2, which returns 14. The IRS corporation statistics methodology builds the same total from purchases, labor, and other inventory costs, then subtracts what is still unsold. A factory-only $12 would leave $2,000 of real cost off both COGS and inventory.
Month one and the roll-forward
In month one, 800 units sell and 200 remain. COGS is 800 times $14, or $11,200. Ending inventory is 200 times $14, or $2,800. Month two opens with that $2,800. It is not a fresh guess. If the next receipt lands at a different unit cost, average cost blends the leftover 200 with the new receipt. FIFO would sell the $14 units first. Either method is fine if every row uses the same one.
A brand-level check uses the summary arithmetic on different balances. $12,000 of opening inventory, plus $8,000 of purchases, minus $9,000 of ending inventory, produces $11,000 of COGS. Shopify's inventory accounting guide uses that periodic equation so purchases still on hand are not expensed in the month they were paid. The same guide's average-cost check is easy to drop in Excel. A different SKU with 100 units sold at a $14.50 average cost is =100*14.50, or $1,450.
Margin before fees
At a $40 selling price, product margin before fees is $40 minus the $14 landed cost, or $26. That $26 is not take-home. The next block is where referral fees and fulfillment sit, and where a $26 product margin gets walked down without being relabeled as COGS.
Keeping Amazon FBA and Shopify Costs Separate
Treat a $24 figure and a $19 figure as two different answers. $40 minus a $10 landed cost is a $30 gross margin. Subtract a $6 referral fee and you are at $24. Subtract a $5 FBA fulfillment fee and the product-level margin before advertising and overhead is $19, not $24. Amazon Seller Central calculates referral fees as a percentage of the total sales price. That price includes the item price and any buyer-paid delivery or gift wrap. Taxes calculated through Amazon's tax services are excluded. A 15% referral fee on $40 is the $6. The fulfillment fee covers picking, packing, shipping, returns, and customer service, and it changes with size, weight, and category. Put the $10 in product COGS. Show the $6 and the $5 as selling and fulfillment expenses. Still include them in true profit.
Amazon's selling-plan FAQ lists a Professional plan at $39.99 per month plus a per-item referral fee. The Individual plan charges $0.99 per unit plus a category referral fee. FBA itself is pay-as-you-go. Storage and fulfillment are paid per unit, and shipping is included on eligible orders. A Professional seller moving 200 units allocates $0.20 of that $39.99 to each unit before referral, fulfillment, storage, ads, or product cost. The same 200 units on the Individual plan cost $198 in plan charges before referral fees.
Three blocks, one margin row
- COGS block: Landed product cost only. For this listing, $10.
- Selling and fulfillment block: Referral fee and the FBA per-unit fee. Here, $6 and $5.
- Plan and storage block: The $0.20 subscription slice, plus storage. Contribution margin is the bottom row.
Shopify sellers can mirror the blocks. Payment processing and app subscriptions are fixed or revenue-linked overhead, not COGS. Inbound FBA placement, which is a real acquisition cost, belongs with landed cost rather than with the selling-fee block. That distinction is laid out in how to add Amazon FBA shipment costs to landed cost.
Leave Amazon fees out of the COGS cell. A sheet that subtracts them there will understate inventory and overstate how "expensive" the product is to reorder.
Fixing Mismatches Between Estimated and Final Costs
Most broken margins trace to two causes. A receipt was missing or double-counted, or a landed cost was estimated before the final bill arrived. A freight quote that excludes surcharges, or a broker bill that lands after the units have sold, will not match the number you used on sale day.
| Symptom | Likely cause | Fix |
|---|---|---|
| Ending inventory does not reconcile | Missing receipt line or duplicated PO line | Match each receipt to its PO line and clear the reconciliation cell to zero |
| Landed cost per unit rises after the final invoice | Estimate used before duty or broker bill arrived | Keep the estimate, post the variance to the period the invoice arrived in |
| Negative inventory on one SKU | Units sold before the receipt was logged | Log the receipt date and restate the period's COGS |
| Past COGS changes when a supplier price is edited | Formulas linked to a live price list | Snapshot prior periods as values each month |
| Amazon margin looks too high | Referral and FBA fees left out of the worksheet | Add a selling and fulfillment block below COGS |
How to post the difference
Keep the estimate in the period it was used. Book the dollar difference in the period the invoice arrives. Never rewrite old COGS to make the year "clean." Each month, copy prior-period values onto a snapshot tab as values, not formulas. A supplier price edit today then cannot change last quarter. Data validation on the SKU column stops a typo from creating a second product that never reconciles.
Treat any variance above 5% of a PO's landed cost as worth checking before that margin feeds a price change or a reorder.
Match the carrier and broker PDFs to the PO line before you accept the variance. A short routine for how to reconcile an invoice keeps the estimate column and the actual column from drifting apart for a second month in a row.
Build Your COGS Workbook Before the Next Order
Build in this order, and stop after each piece passes its own test.
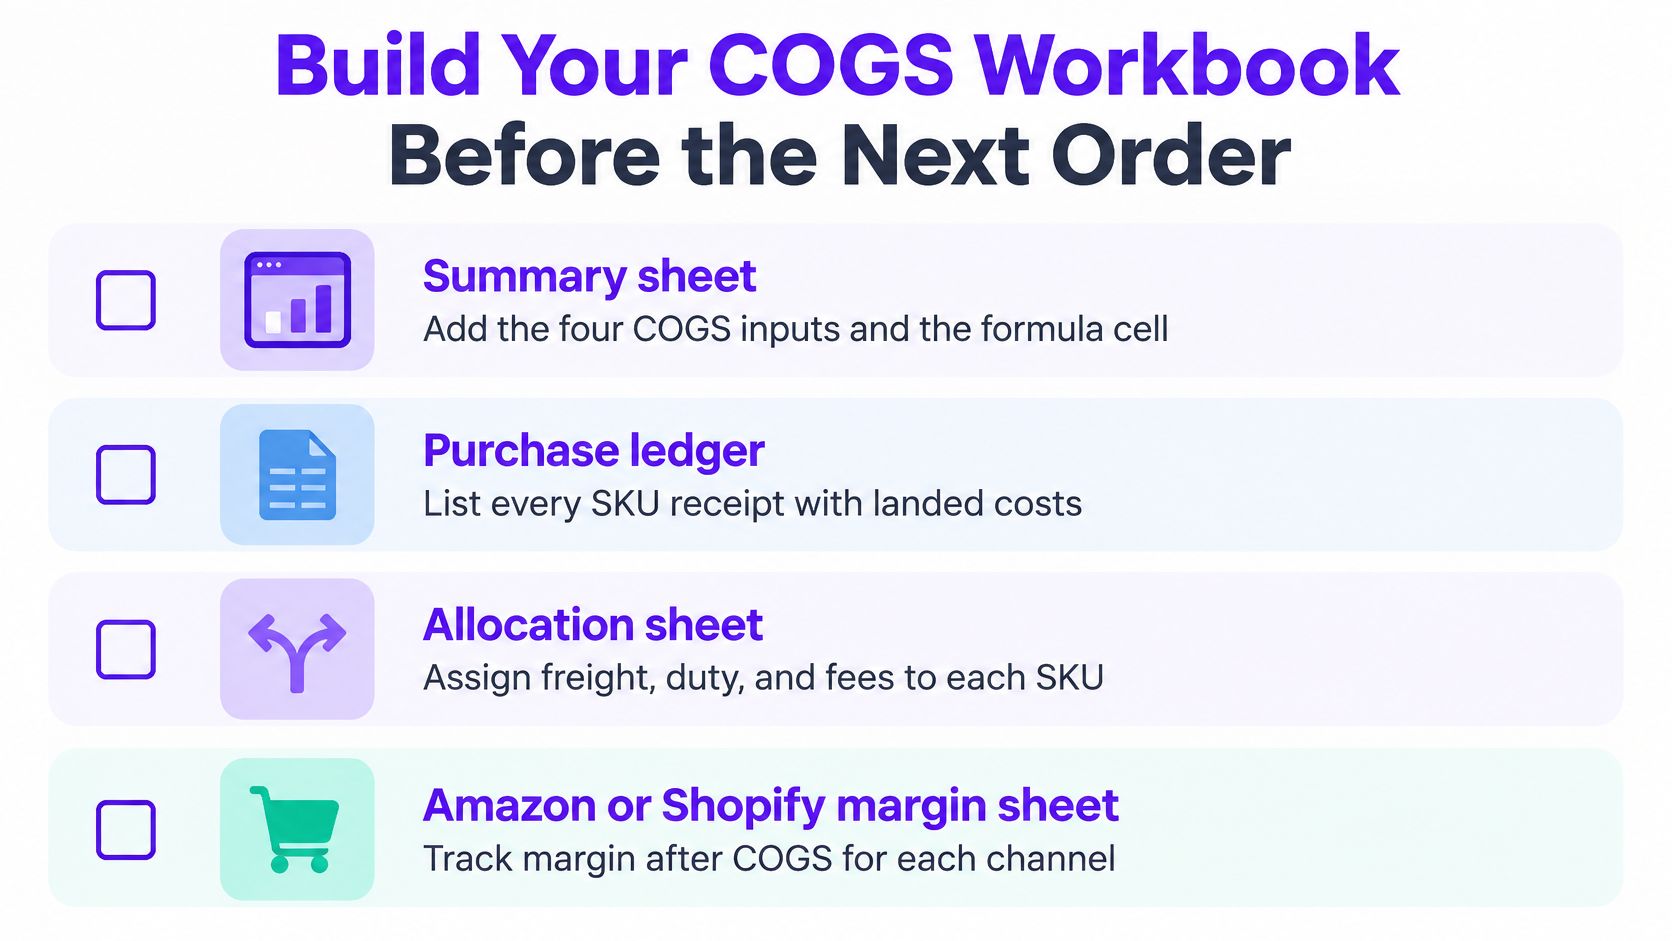
- Summary sheet. Four inputs and
=B2+B3+B4-B5. Bump one input and confirm COGS moves with it. - Purchase ledger. One row per SKU per receipt, extended cost, and landed unit cost.
- Allocation sheet. A chosen basis, an estimate column, and an actual column.
- Amazon or Shopify margin block. COGS, then fees, then plan charges, then contribution margin.
Before the next order, opening inventory must equal last period's closing value, every receipt from the last two POs must be logged, and the landed-cost column must have no blanks. Paste one real PO in as the test case. If the bulky SKU doesn't pick up more freight under a volume split, fix the basis before you trust a price.
The free Landed Cost Calculator estimates true cost per unit before you order, so the test PO isn't the first time you see a number. A free Excel P&L template from Supply Automate uses the same per-order formulas to track real orders across a month, and it can sit beside this COGS sheet. The dropshipping version of that P&L template is free to download, needs no email or signup, and is free to use commercially. It won't replace the inventory roll-forward, but it will show whether fee-heavy orders still clear after COGS is honest.
Stay in the workbook while three things stay small. You have few active SKUs, only one or two open POs, and landed costs rarely change after arrival. Move the ledger into a system when SKU count, overlapping POs, or post-arrival bill changes make the snapshot-and-reconcile routine something you skip.
Supply Automate gives Shopify and Amazon brands one place to track purchase orders, supplier invoices, and SKU-level landed cost, including freight, duty, and fees, before those numbers hit a spreadsheet. The same workspace exports purchase orders and landed-cost reports to Excel, so the calculator you just built can start from real receipts instead of a factory quote. Visit Supply Automate to try the free calculators or run a live PO through the landed-cost engine.