The founder's dashboard looks reassuring: in a hypothetical month, 96% of shipments left on time. Yet Amazon receiving discrepancies keep appearing, Shopify customers report missing items, and the warehouse is chasing corrected paperwork. The team shipped promptly, but it didn't consistently ship the right quantities with the right documents.
For a small importer, useful supply chain KPIs connect those failures to decisions and dollars. They show which supplier needs attention, which inventory isn't actually sellable, and whether preventing a stockout would protect enough gross profit to justify better tracking.
The Supply Chain KPIs That Matter and How They Group
A dashboard is only useful when its gauges answer different questions. A car's speedometer doesn't reveal fuel level or engine temperature; similarly, shipment punctuality doesn't reveal completeness, cash exposure, or margin.
A key performance indicator, or KPI, needs a fixed formula, a named owner, and a time window. “Supplier performance” is a topic. “Purchase orders shipped by their committed date, divided by purchase orders due during the month” is a measure someone can calculate and act on.
The Supply Chain Operations Reference framework, established in 1996, originally organized activity around Plan, Source, Make, and Deliver and evaluates performance through reliability, responsiveness, agility, cost, and asset-management efficiency. Those groups help an importer balance service against speed, cost, and cash rather than optimizing one number in isolation.
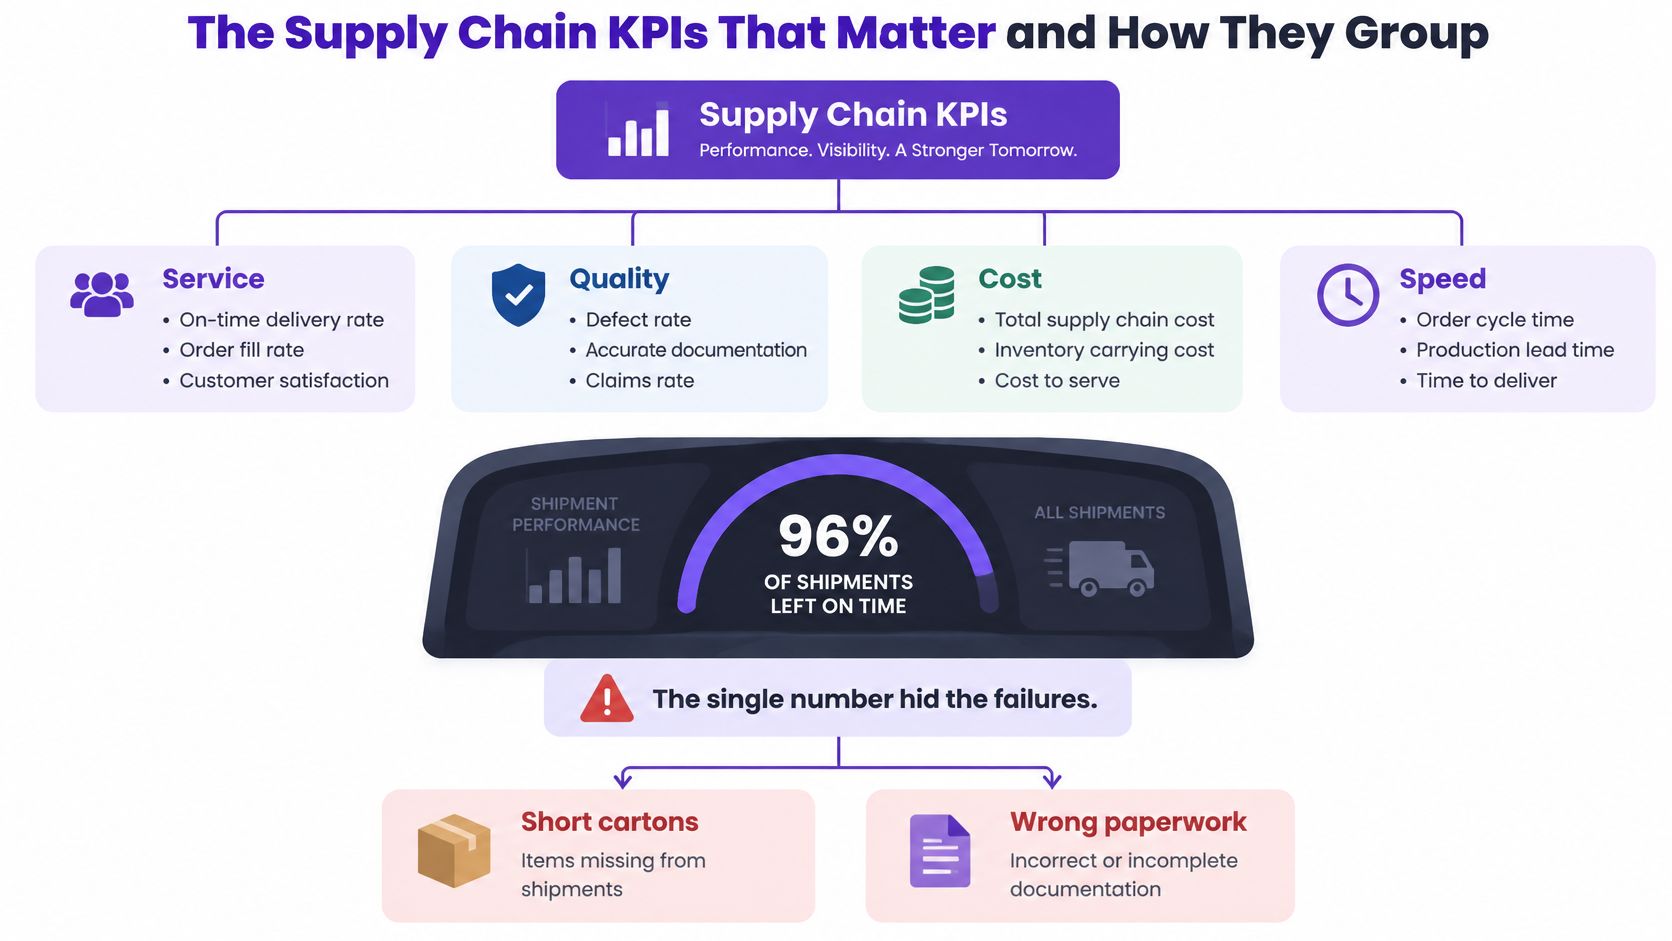
Core supply chain KPIs by SCOR attribute
The following is a practical importer dashboard mapped to those attributes, not a claim that every operational definition is an official SCOR metric.
| KPI | SCOR attribute | Formula | What it reveals |
|---|---|---|---|
| Perfect order rate | Reliability | Perfect orders ÷ total orders × 100 | Failures that on-time rate hides |
| Supplier on-time delivery | Reliability | POs shipped by committed date ÷ total POs × 100 | Which factories keep their dates |
| Order fulfillment cycle time | Responsiveness | Average days from order placed to shipped | How fast demand becomes shipments |
| Actual lead time | Responsiveness | Days from PO sent to sellable stock received | Real lead time, not the factory's estimate |
| Supplier confirmation time | Agility | Hours from PO sent to supplier confirmation | How quickly a supplier responds to change |
| Landed cost per unit | Cost | (Product + freight + duty + fees) ÷ units received | True margin before the sale |
| Days inventory on hand | Asset management | Inventory value ÷ daily COGS | How much cash sits in stock |
| Cash-to-cash cycle time | Asset management | DIO + DSO − DPO, in days | How long working capital stays tied up |
Endpoint definitions matter. The fulfillment-cycle formula above ends at shipment, not customer receipt. Supplier confirmation time is an early responsiveness signal grouped under agility here, but a quick acknowledgment alone doesn't prove a factory can accommodate change.
The stakes extend beyond reporting: the 2025 Maersk and FT Longitude survey found that resilience frontrunners lost less than 1% of revenue to disruptions in their most recent fiscal year, compared with 3.9% across surveyed companies. That's context for measuring disruption exposure, not proof that a dashboard alone creates resilience.
Measurement rule: Before recording a result, document its formula, denominator, counting window, and exception policy so different employees calculate the same figure.
Why Perfect Order Rate Beats On-Time Delivery
An on-time shipment can still create a refund, replacement, or receiving dispute. If a carton arrives short, the customer doesn't receive the promised order, regardless of the delivery timestamp.
Perfect order rate measures the whole promise. The SCOR reliability definition requires orders to arrive on time, complete, damage-free, and with accurate documentation; the accompanying APQC-style example uses component rates of 98%, 97%, 99%, and 82%, respectively, producing roughly 77% perfect-order performance.
How good-looking components produce a weak result
Consider a hypothetical 1,000-order period using those component rates:
- On time: 980 orders meet the timing requirement.
- Complete: 970 contain everything ordered.
- Damage-free: 990 arrive without damage.
- Accurate documents: 820 have correct documentation.
Those counts describe separate checks across the same order population. They don't reveal which orders failed several checks at once.
When order-level records aren't available, multiplying the component rates gives a rough composite estimate:
0.98 × 0.97 × 0.99 × 0.82 × 100 ≈ 77%
That corresponds to roughly 772 perfect orders in this hypothetical population. The estimate is much weaker than the delivery-only result because paperwork accuracy is substantially lower than the other components.
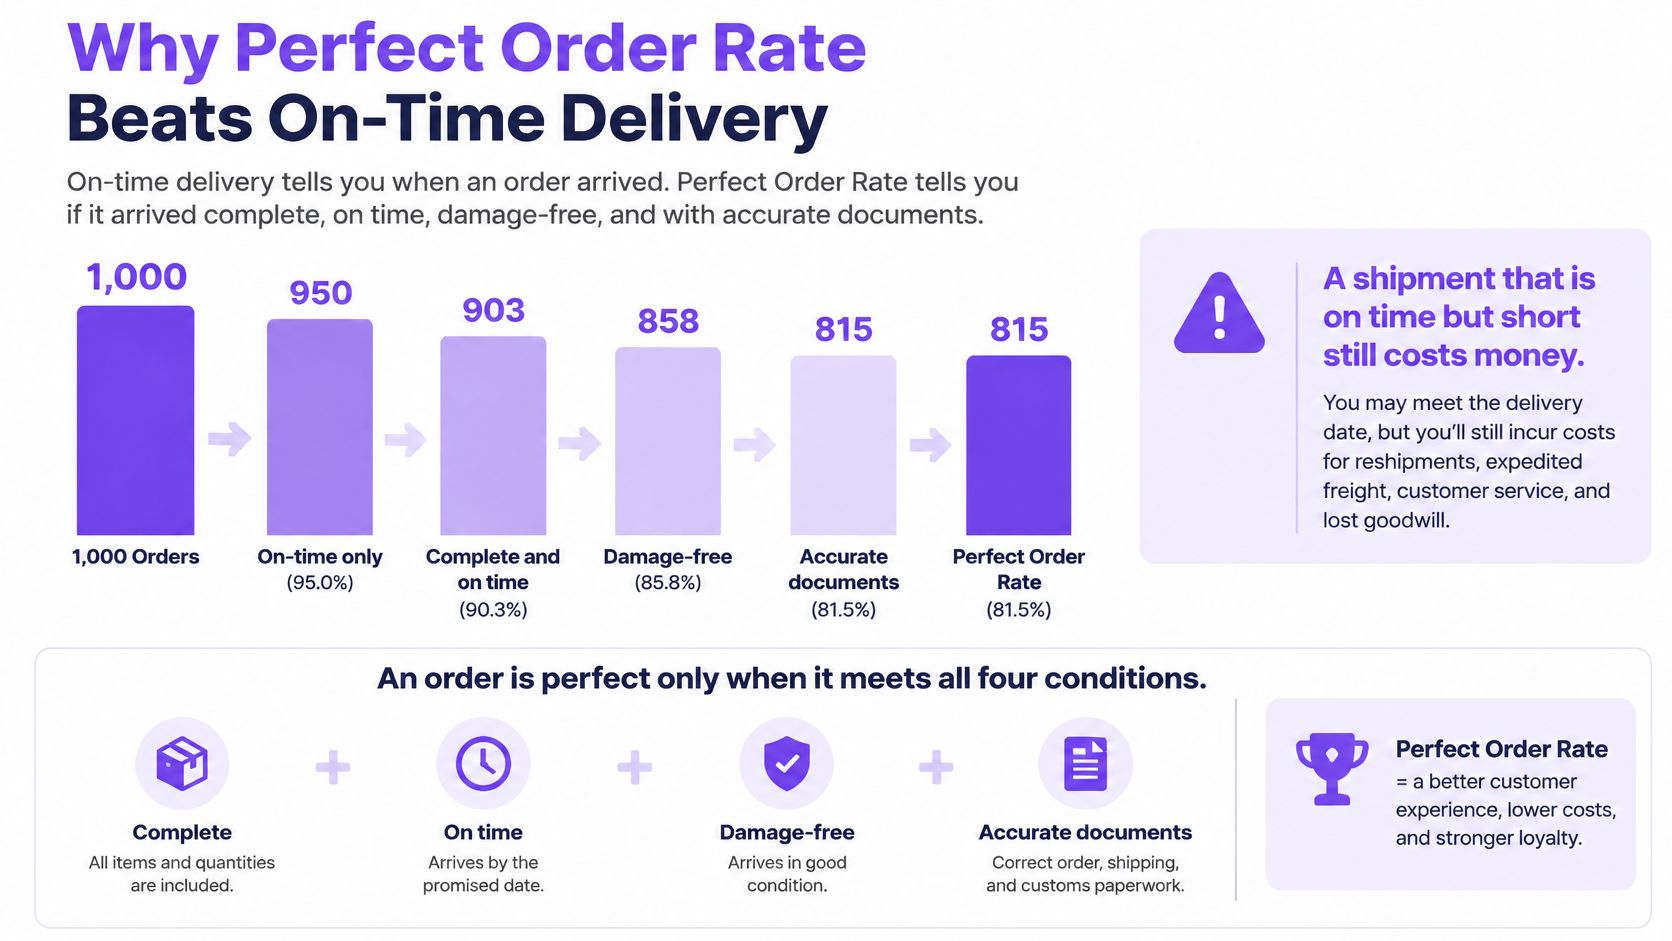
Count directly whenever possible
The stronger method is perfect orders ÷ total orders × 100, using an order-level pass or fail across all requirements. An order with both damage and incorrect paperwork counts as one failed order, while its record retains both failure reasons.
Multiplying separate percentages is only an estimate because failures may overlap or cluster. Averaging the percentages is worse: it allows strong delivery performance to conceal weak documentation and doesn't measure the share of orders meeting every requirement.
For an importer, document checks should connect the purchase order, packing list, commercial invoice, carton count, and actual shipped units. The coordinator should reconcile quantities, confirm SKU identifiers, and resolve discrepancies before release, not after a warehouse rejects the shipment.
A paperwork correction before pickup is an operational task. The same correction after arrival can become a receiving delay, a customer problem, and a margin expense.
Documentation is often a lower-cost starting point than changing factories or freight services. A consistent pre-release checklist may improve reliability without shortening transit time at all.
Timing still needs its own early-warning process. Guidance on using supplier management software to flag late shipments early helps distinguish a missed production milestone from a delivery failure that has already occurred.
Cash and Inventory KPIs That Free Up Working Capital
A profitable product can still leave a founder short of cash. Suppliers may require payment long before the goods become sellable, while marketplace settlement timing adds another wait after the sale.
Cash-to-cash cycle time describes that working-capital gap. The APQC SCORmark survey framework measures it as days inventory outstanding + days sales outstanding − days payables outstanding, expressed in days.
Follow one brand's cash
Consider a hypothetical importer with 75 days of inventory, 10 days to collect marketplace payouts, and 30 days of supplier payables. Its simplified calculation is:
75 + 10 − 30 = 55 days
The business has the equivalent of 55 days of working capital tied up in this operating cycle. For planning, marketplace settlement lag can serve as a collection-delay input, provided finance applies the same accounting treatment consistently.
Suppose the same brand has $300,000 in annual cost of goods sold. Dividing by a 365-day planning year gives approximately $822 in daily COGS; reducing inventory days by 15 would release roughly $12,300 under this simplified scenario.
That release isn't additional gross profit. It's cash no longer committed to the same amount of inventory, assuming sales and purchasing patterns remain comparable.
| Hypothetical change | Cash effect | Check before acting |
|---|---|---|
| Smaller, demand-aligned replenishment | Less inventory investment | Freight economics and stockout exposure |
| Faster PO approval | Less avoidable waiting | Supplier capacity and production readiness |
| Negotiated payment terms | Later cash outflow | Discounts, supplier stability, and agreement |
| Earlier landed-cost visibility | Better purchasing decisions | Complete freight, duty, and fee inputs |
Separate inventory efficiency from inventory starvation
A company-wide average can conceal a slow overseas product family beside a fast domestic replenishment line. SKU-family reporting makes it easier to decide whether excess days come from weak demand, oversized orders, production delays, or transit time.
For sellers allocating the same inventory across storefronts and marketplaces, SellerAI's guide to multichannel inventory provides useful context for coordinating channel stock. That allocation should use a consistent inventory record rather than independent channel spreadsheets.
Targets also need a buffer for uncertainty. A documented method for calculating safety stock helps prevent a cash-efficiency target from becoming an instruction to understock.
Long lead times and unexpected freight or duty costs increase inventory investment. Pair cash-to-cash with actual lead time, landed cost, stockouts, and gross margin before reducing purchases.
Negotiated terms can help; late payment isn't an improvement strategy. Demanding earlier supplier payment would shorten payables days and worsen the cycle, while unilaterally delaying payment can damage continuity and discounts.
Amazon FBA and Shopify KPIs in Daily Operations
Amazon FBA sellers need to distinguish missing inventory from eligible, recoverable inventory. A discrepancy report starts an investigation; it doesn't establish reimbursement entitlement.
Under Amazon's FBA inventory reimbursement policy, eligible inventory lost or damaged at an Amazon facility or by an Amazon-operated or contracted carrier may be replaced or reimbursed, with a maximum reimbursement of $5,000 per eligible unit. Conditions include FBA registration, compliance with inventory requirements, and matching the exact item and quantity in the shipping plan.
Amazon FBA recovery requires two denominators
For the policy's example of a 1,000-unit shipment, 8 eligible lost units, and 6 reimbursed units, the claim recovery rate is 75%, leaving 2 units of unrecovered sourcing cost. Using the same example, eligible loss divided by shipped units produces an eligible-loss rate of 0.8%.
These measures answer different questions. Eligible-loss rate describes exposure, while claim recovery rate shows how much eligible loss the seller recovered.
Pre-fulfillment shipment, removal, and fulfillment-center reimbursements use sourcing cost under the stated policy, not expected retail revenue. Claims also require checks for exclusions, including defective or customer-damaged goods, disposal status, and canceled or deleted shipments.
A practical Amazon FBA inventory management workflow should therefore preserve shipment plans, quantities, sourcing costs, and claim outcomes together.
Shopify requires a sellable balance
Shopify's inventory documentation distinguishes incoming, on-hand, available, committed, reserved, damaged, safety-stock, and quality-control states. A warehouse total isn't automatically the quantity the storefront can promise.
Consider a hypothetical SKU with 500 on hand, including 80 committed, 20 reserved, and 100 in quality control, with no overlap between those categories:
500 − 80 − 20 − 100 = 300 sellable units
Treating all 500 as available would overstate availability by 200 units. Incoming units should remain outside that promiseable balance until receipt and release.
Fulfillment speed also needs segmentation. Shopify supports self-fulfillment, fulfillment services, and combinations of methods, including different methods within an order.
In a hypothetical operation where a 3PL handles 90% of orders in 18 hours and internal packing handles 10% in 78 hours, the weighted average is 24 hours. That average conceals the internal queue.
Channel KPIs for Amazon FBA and Shopify sellers
| KPI | Amazon FBA | Shopify (self or 3PL fulfilled) |
|---|---|---|
| Sellable stock | Fulfillable units versus unfulfillable and inbound | On hand minus committed, reserved, and quality-control units |
| Loss and damage | Eligible-loss rate and claim recovery rate | Damaged units tracked apart from sellable stock |
| Receiving speed | Days from inbound arrival to sellable stock | Days from PO receipt to stock released for sale |
| Pick-to-ship time | Not controlled by seller once stock is at the fulfillment center | Hours from order to carrier handoff, split by fulfillment method |
| Order accuracy | Customer reports of wrong or missing items | Orders shipped complete and correct, by location |
| Stock location fit | Units per fulfillment center versus demand by region | Share of orders routed to the intended warehouse |
| Cost per order | Fees per unit shipped | Fulfillment and shipping cost per fulfilled order, by channel |
Location reporting matters because Shopify assigns online orders according to available inventory and configured routing rules. A merchant should compare delivery performance and shipping cost by warehouse, not assume a healthy aggregate stock balance means the right stock is near the customer.
Spreadsheets, WhatsApp, or a Platform Compared
A founder starts with a spreadsheet, adds a WhatsApp group for the factory, and sends revised purchase orders by email. In a hypothetical business, the fifth overlapping PO becomes the point when nobody can identify the current PDF without asking around.
The choice isn't manual versus automated. It's whether the records preserve enough context to calculate trustworthy KPIs.
Spreadsheets, chat threads and a dedicated platform compared
The platform column describes capabilities to verify, not features every software product necessarily includes.
| Criterion | Spreadsheet | WhatsApp or email | Dedicated platform |
|---|---|---|---|
| Supplier messages tied to each PO | Manual links between files | Scattered across chats | Threaded on the order |
| PO version control | File names such as final_v3_final2 | Lost in scrolling history | One record with change history |
| Landed cost per SKU | Manual formulas that break when inputs change | Not tracked | Calculated from PO, freight, and duty |
| Production milestone tracking | Manual status column | Asked verbally | Stage dates attached to each order |
| Outside party access | Emailed copies that go stale | Personal phones | Permissions set per collaborator per order |
| Data export | Native file format | Copy and paste | CSV or Excel export |
| Best fit | Under about five active POs with one supplier | Informal, single-supplier relationships | Several overlapping POs and collaborators |
The spreadsheet threshold is an operating rule of thumb, not an industry benchmark. Complexity matters more than a precise PO count: a small order book with frequent revisions and several collaborators can require stronger controls than a larger, repetitive one.
Choose by coordination burden
- A spreadsheet can remain sufficient when an operator manages fewer than about five active POs, one supplier, and no outside collaborators. Protected formulas, document links, and a change log still matter.
- Chat works as a conversation channel, especially in a simple supplier relationship. It becomes unreliable as the sole record when committed dates, revised quantities, and approvals disappear into scrolling history.
- A dedicated platform earns consideration when POs overlap, agents and warehouses need different access, or finance needs landed cost before goods leave port. Its value depends on eliminating repeated reconciliation, not producing a prettier dashboard.
A useful test is whether another employee can reconstruct an order without calling the person who placed it. If the answer requires searching a phone, an inbox, and several spreadsheet tabs, the business has a recordkeeping problem before it has an analytics problem.
The system of record should contain the decision, its supporting document, and the date it changed.
A hybrid approach can work well: operational records live in one controlled workspace, while Excel remains the reporting and analysis layer. A structured transition from Excel to automated purchase order tracking should preserve useful fields and historical records rather than forcing a blind restart.
Calculating the Return on Tracking Your KPIs
ROI = (Annual benefit − annual cost) ÷ annual cost × 100
The benefit should reflect avoidable losses, not revenue attached to every delayed shipment. A founder needs to know which missed signal could have changed a purchasing, production, or freight decision.
Convert a stockout into gross profit dollars
Consider a hypothetical SKU generating $400 in daily sales at a 40% gross margin. It produces $160 in daily gross profit, so a 14-day stockout represents $2,240 in lost gross profit, assuming those sales disappear rather than shift to another product or a later date.
Suppose better tracking prevents two such stockouts annually. That protects $4,480, and avoiding an emergency air shipment with $1,500 in incremental cost brings the illustrative annual benefit to $5,980.
| Hypothetical annual calculation | Amount |
|---|---|
| Gross profit protected from avoidable stockouts | $4,480 |
| Incremental emergency freight avoided | $1,500 |
| Total benefit | $5,980 |
| Assumed tracking cost | $1,200 |
| Net benefit | $4,780 |
| ROI, rounded | 398% |
The assumed $1,200 annual cost is a modeling input, not a vendor quote. The operator should replace it with actual subscription, setup, training, integration, and ongoing administration costs.
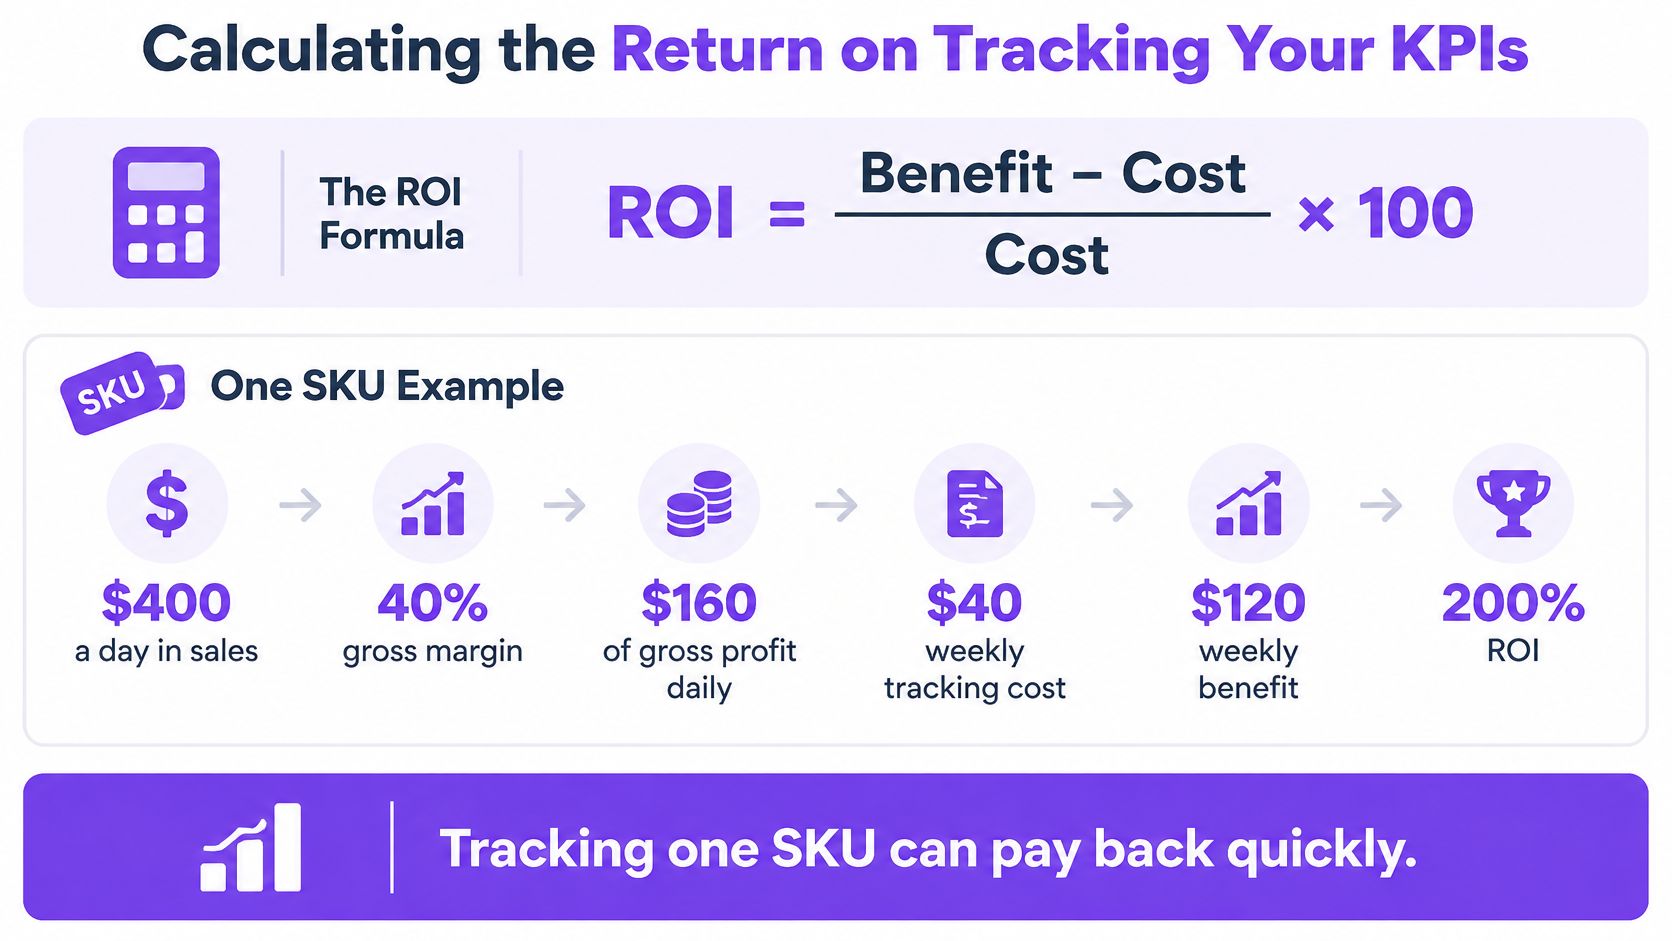
Check the counterfactual before claiming savings
The calculation is ($5,980 − $1,200) ÷ $1,200 × 100 ≈ 398%. Under the stockout-only comparison, break-even is $1,200 ÷ $160 = 7.5 avoided stockout days for this hypothetical SKU.
- Test preventability. A late-production alert creates value only if someone still has time to act.
- Avoid double counting. Freight savings and protected gross profit must reflect a consistent alternative scenario, not incompatible outcomes.
- Price employee time. Reconciliation hours have a loaded labor cost, but saved time becomes a cash saving only when expenditure falls.
- Check contribution economics. Marketplace fees and other variable selling costs may reduce the benefit below gross profit.
An exception log should connect each claimed saving to an action and a plausible alternative outcome. That makes the investment case more credible than assigning a dollar value to every dashboard improvement.
Testing KPI Software Before You Buy
A live test with an actual purchase order reveals more than a polished feature tour. The purchasing coordinator should bring a supplier invoice, a revision, a shipping document, and an example of a delayed milestone.
The evaluation should record pass, fail, or unresolved, with evidence attached. A feature that appears in a presentation hasn't passed an operational test.
Run the order through the workflow
- Time document intake. Upload a real supplier invoice and inspect the resulting order view. Passing means usable supplier, SKU, quantity, price, and document fields in minutes, not an afternoon of cleanup.
- Move through production. Follow the PO through quote, deposit, production, ready, and shipped. Each stage needs a stored date so lead-time reporting can distinguish waiting from work.
- Test supplier participation. Use a supplier who communicates only through WeChat. The test should establish whether the supplier can join the order conversation and share updates without abandoning the communication workflow.
- Post a warehouse update. Give a 3PL or internal warehouse test account a shipment task. Passing means the update lands on the correct PO rather than in a separate inbox.
- Challenge permissions. Assign view-only access to a selected order and attempt to open an unrelated order. Access controls fail if the collaborator can view hidden commercial information or edit restricted fields.
- Export the evidence. Download POs, supplier messages, shipping invoices, and cost reports to CSV or Excel. Inspect identifiers, dates, amounts, message content, and document references for missing fields.
- Reconcile inventory stages. Check ordered, in-production, in-transit, and delivered quantities against the underlying order and shipment records. A status label without quantity reconciliation isn't enough.
Check portability and trial conditions
Supply Automate allows a 3PL provider or internal warehouse team to post shipment and inventory updates directly to a PO, and users can export purchase orders, supplier communications, shipping invoices, and landed-cost reports to CSV or Excel at any time. Its order collaboration also supports suppliers who communicate only over WeChat and per-order controls over collaborator access.
The trial should last a full month without a credit card, so the team can test real purchasing activity rather than a staged dataset. Supply Automate offers those trial conditions; the trial still needs to demonstrate suitability for the brand's own workflow.
A comparison of software for purchase order management can help organize candidate tools. The buying decision should rest on completed tests and reliable exports, not the length of a feature list.
Start With Five KPIs in a 90-Day Rollout
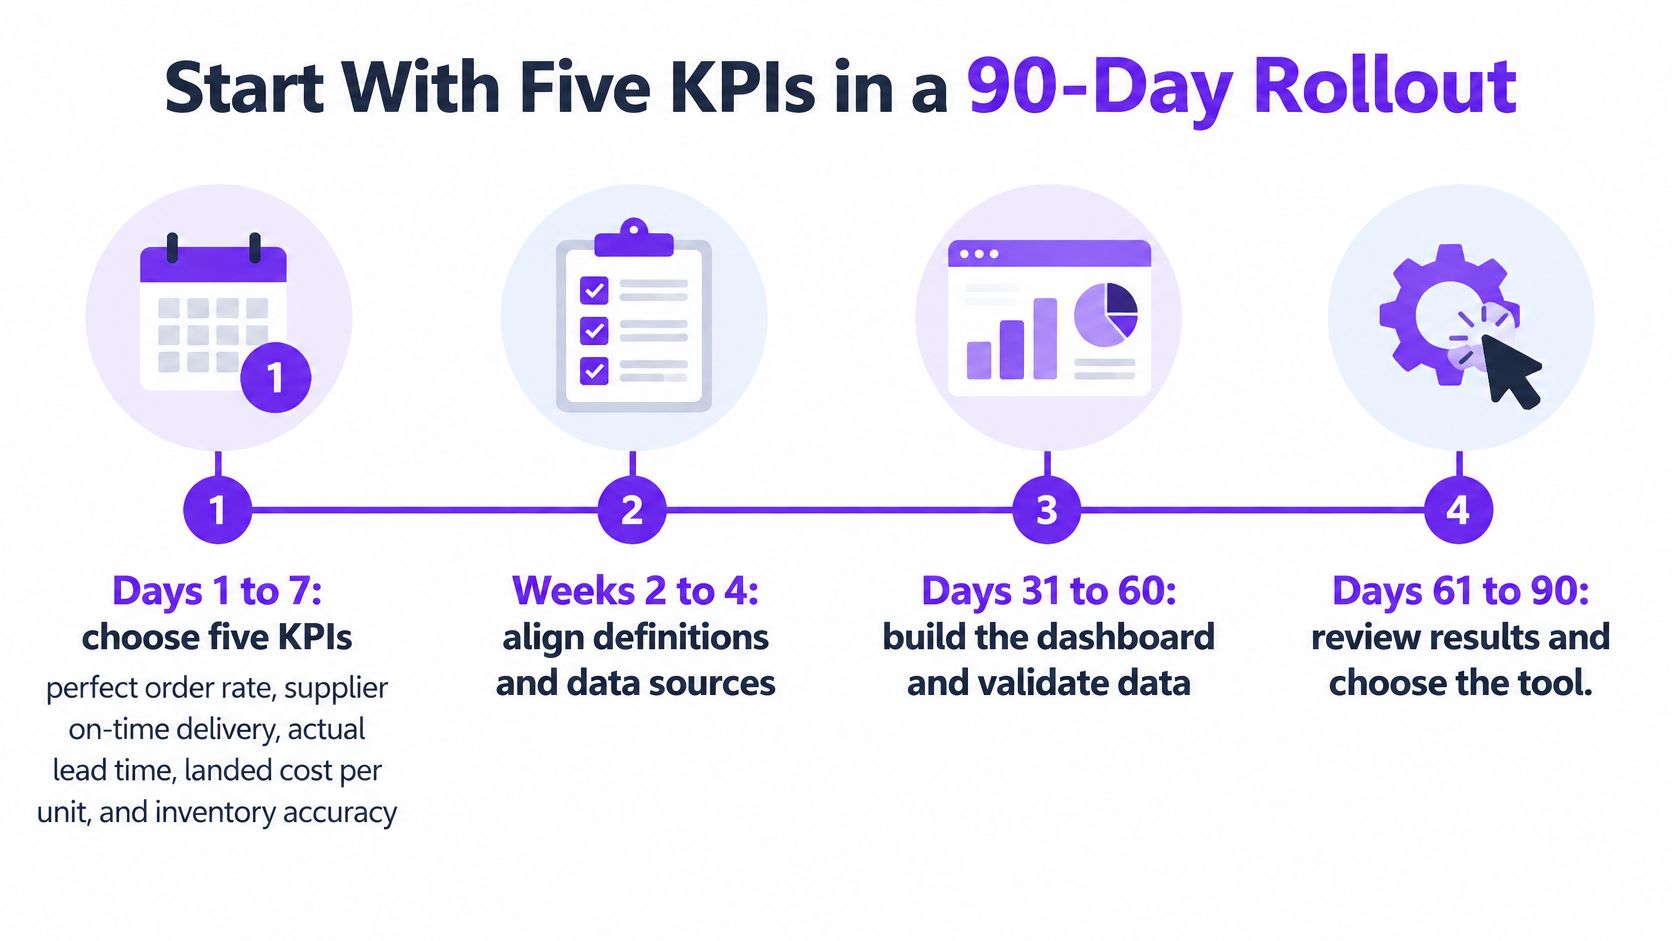
A manageable rollout gives the business a trusted baseline before anyone configures alerts or buys software. The following 90-day schedule is a proposed implementation plan, not a promise of performance improvement.
The owner should assign a purchasing lead and a finance reviewer. Purchasing validates dates and quantities; finance checks inventory valuation, landed-cost inputs, and the treatment of cash movements.
Establish the manual baseline
- Days 1 to 7, choose five KPIs. Start with perfect order rate, supplier on-time delivery, actual lead time, landed cost per unit, and cash-to-cash cycle time. Create a definition sheet with the formula, denominator, owner, source document, counting rule, and review window for each.
- Days 8 to 30, reconstruct one product family. Gather the previous 90 days of POs, invoices, and shipping documents, then calculate the measures manually in a spreadsheet. Missing evidence should remain visible as a data-quality exception rather than becoming an assumed success.
The first result may be uncomfortable. A business may discover that its team records revised promises but not original dates, or that freight bills can't be assigned confidently to individual SKUs.
Use exceptions to make the tool decision
- Days 31 to 60, review weekly. Set a target for each KPI based on the observed baseline and commercial priorities. Log exceptions with a cause, owner, action, and follow-up date, separating supplier delays from internal approval delays and warehouse receiving holds.
- Days 61 to 90, extend and decide. Add the relevant Amazon FBA or Shopify measures and check days inventory on hand. Compare the manual results against the live software tests, then choose a spreadsheet, dedicated platform, or hybrid system of record.
Inventory accuracy should act as a validation check throughout the rollout, particularly when warehouse balances disagree with channel availability. It can join the ongoing dashboard once the team can reconcile discrepancies consistently.
During Supply Automate onboarding, existing POs, invoices, and shipping documents are uploaded as PDFs, and a single invoice becomes an organized order view in well under a minute. Faster intake helps migration, but it doesn't replace the manual baseline or resolve unclear measurement rules.
The baseline should precede the purchase. It identifies the fields, timestamps, permissions, and reports any selected tool must support, giving the team a concrete acceptance standard rather than a general hope for better visibility.
Supply Automate brings purchase orders, supplier communication, production milestones, and landed-cost information into a shared workspace for e-commerce operations. Brand owners can visit Supply Automate and test a real purchase order against their KPI definitions, warehouse updates, and export requirements before committing to a new system.