Annual carrying cost equals average inventory value multiplied by the annual carrying-cost rate, and that rate is built from four buckets: capital, storage and handling, inventory service, and inventory risk. A brand holding $500,000 of average inventory at a 24% rate is carrying $120,000 a year, and it pays that whether or not a single unit sells.
Your bestseller sells out in nine days. The 800-unit accessory buy from last spring is still on a 3PL shelf, billing you monthly for space, insurance, and cash you can't put anywhere else. The sellout gets the celebration and the shelf gets the invoice, and nobody adds the two together.
That gap is what the inventory carrying cost formula exists to close. It converts holding cost into a dollar figure you can set against margin, then against another SKU, then against a reorder decision you're about to make. Most sellers quote a range they heard once and never build their own rate, which is why they can't tell which product is eating the profit from the one that isn't.
Build the formula against your own catalogue as you read: average landed inventory value, times your rate, and you have the number the rest of this page sharpens.
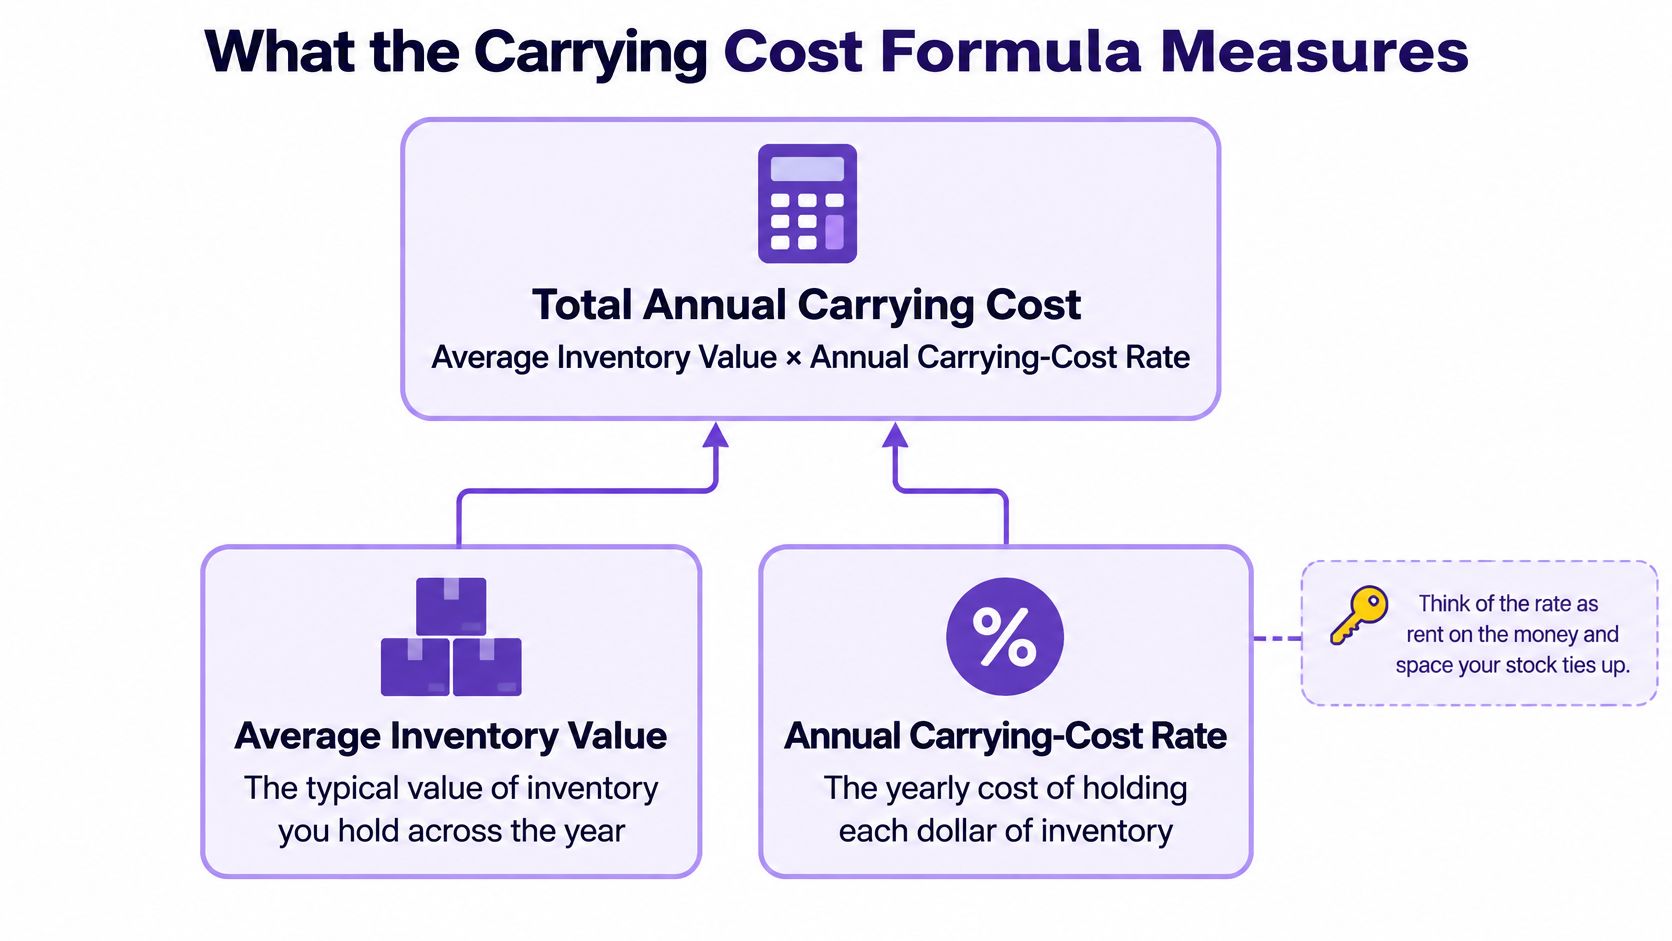
What the Carrying Cost Formula Measures
The foundational version of the inventory carrying cost formula multiplies average inventory value by an annual carrying-cost rate, the structure the Iowa State University supply chain library sets out. Two words in that sentence do most of the work. Average, not month-end. Annual, not per shipment. Get either wrong and every figure downstream drifts.
The rate behaves like rent on the money and the space your stock occupies. You pay it for every month an item sits in a bin, and you pay the same amount whether it sells tomorrow or gets liquidated next spring.
The per-unit version of the same math
Shrink the formula to one item and it becomes H = unit cost × holding-cost percentage. A $40 item at a 24% rate carries $9.60 of annual holding cost per unit, which is the figure that plugs into reorder point and EOQ models. A 400-unit average of that same item carries $3,840 a year before anyone asks whether it should still be in the catalogue.
Four buckets make up the rate
| Component | What it covers | Shopify or Amazon example |
|---|---|---|
| Capital | Opportunity cost of cash tied up in stock | Loan interest or cash that could earn returns elsewhere |
| Storage and handling | Warehouse space, utilities, labor and inventory control | 3PL storage and pick fees |
| Inventory service | Insurance and inventory-related taxes | Insurance premiums on goods held in a warehouse |
| Inventory risk | Shrinkage, damage, obsolescence and deterioration | Markdowns and write-offs on slow-selling SKUs |
Add those four for a year, divide by average inventory value, and the result is your rate. The same reference works the arithmetic both ways: $500,000 of average inventory at 24% produces $120,000 in annual carrying cost, roughly $10,000 a month.
One adjustment matters more for e-commerce than for any other kind of seller. The inventory base should be fully landed cost, not the supplier's invoice price, because freight, duties, insurance and import fees are all cash committed to that stock until it sells. A duty-heavy SKU at a $12 factory price and a $15.50 landed cost carries 29% more inventory value than the invoice suggests, and the rate magnifies that difference every month.
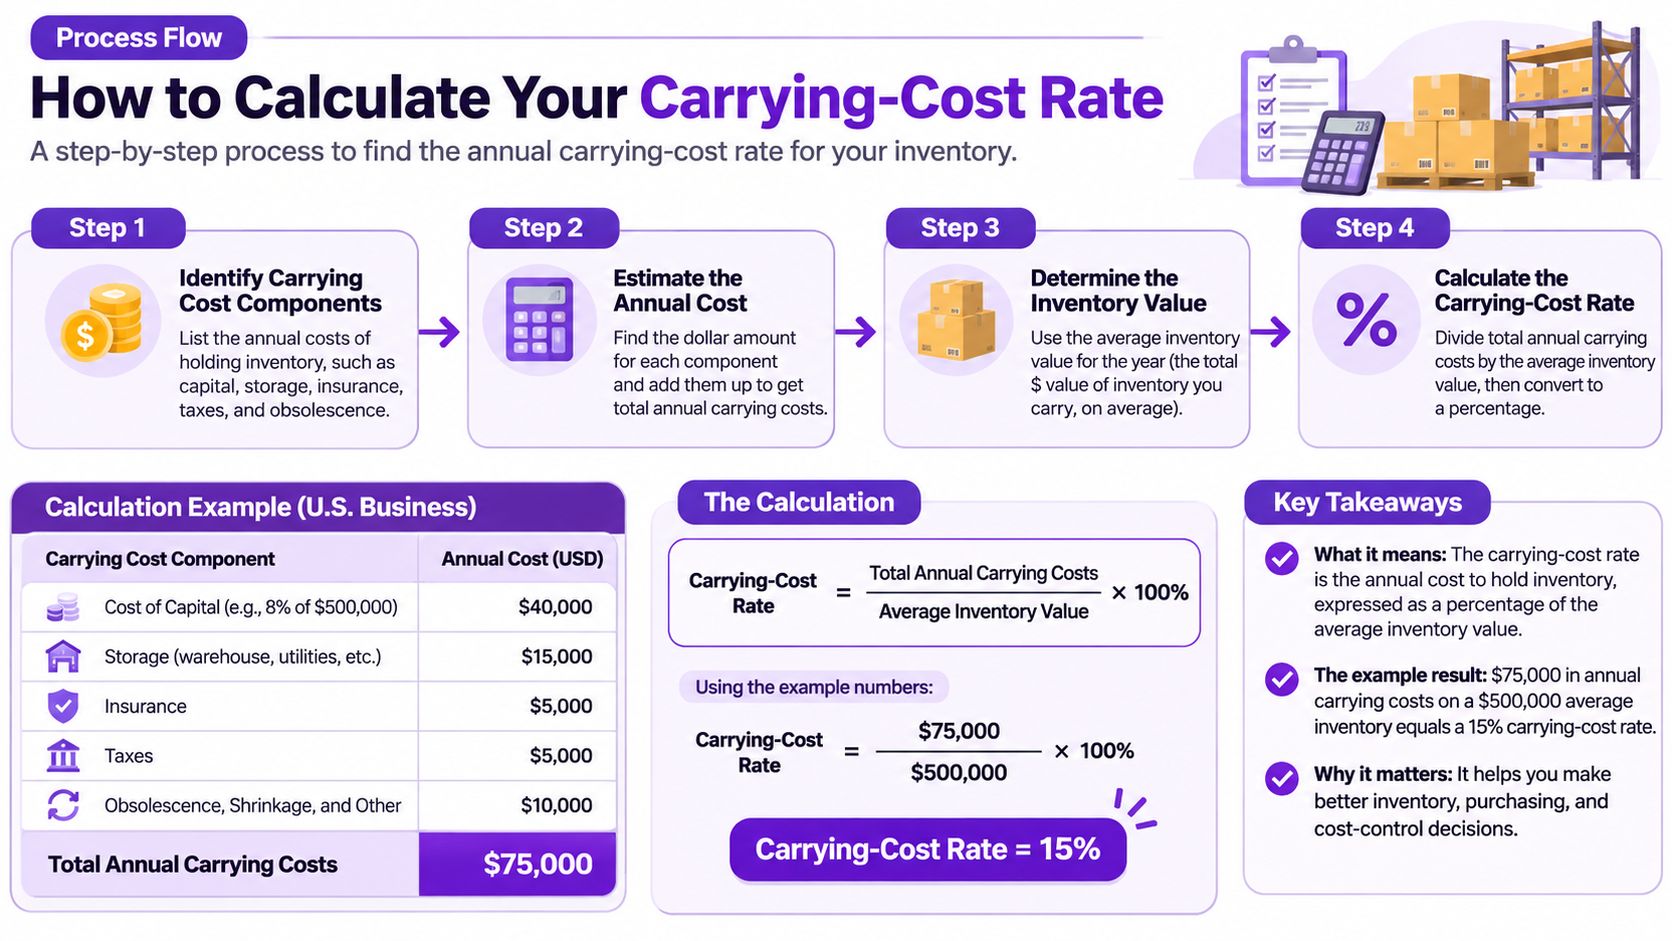
How to Calculate Your Carrying-Cost Rate
Published percentages are other people's costs. Your rate has to come from your own ledger, built once and refreshed as finance, warehouse and insurance costs move. Every input below comes from a document you already have somewhere.
- Average the inventory base. Add 12 month-end landed values and divide by 12. A midpoint of opening and closing balances misreads any brand that builds stock for a peak season, because the peak month never appears in either balance. Landed value means factory price plus freight, duty and insurance, and the landed cost formula explained here shows why duty-heavy SKUs swing the base hardest.
- Price the capital. Multiply average inventory value by the return you expect on cash. A working-capital hurdle of 10% to 12% is a sensible small-brand starting point. Use a hurdle rather than your borrowing rate, because equity-funded stock still costs the returns it can't earn elsewhere.
- Total storage and handling. Add 12 months of 3PL storage, pick and pack, receiving labor, and your share of warehouse rent and utilities. Include only the space and labor that rise and fall with stock levels. A lease you'd sign at half the inventory is a fixed cost, not a carrying cost.
- Add inventory service costs. Insurance on stock, inventory-related taxes, and inventory software subscriptions. Small lines individually, but each one scales with how much you hold, which is exactly the test for inclusion.
- Add observed risk. Shrinkage, damage, markdowns and write-offs recorded over the same 12 months. Use the write-off report, not a hopeful estimate. Where your accountant values closing stock on a different basis, the numerator and denominator stop agreeing, so the trading stock valuation rules from EndureGo Tax are worth reading before your finance lead reconciles the two.
- Divide. Rate = (capital + storage + service + risk) ÷ average inventory value × 100. Then divide annual dollars by 12 for a monthly figure, and multiply the rate by one unit's landed cost for a per-unit holding cost.
- Sanity-check the period. Every input must cover the same 12 months. A 3PL invoice from a peak quarter against an annual average will inflate the rate for the following year.
Practical rule: if you can't trace a line to a document, leave it out for this quarter and add it when the invoice exists. A slightly understated rate you'll actually rebuild beats a complete one you abandon.
Why Your Rate Differs From Published Benchmarks
Published percentages are planning parameters, not constants, and they measure at least three different things. Keep them apart before you compare your own number to any of them.
- Supply-chain references place annual carrying cost at 10% to 35% of inventory value, with broader retail and business references commonly at 20% to 30% (Finale Inventory).
- Financial modeling in 2026 estimates 20% to 30% of average inventory value (WISS).
- A 2025 to 2026 ecommerce benchmark puts the range at 20% to 35%, built from capital, storage, insurance, shrinkage, obsolescence and handling (Calcrux).
Those are percentages of inventory value. Don't confuse them with a share of logistics spend, which is a different measure: inventory carrying costs were 30.4% of total U.S. business logistics costs in 2025, against 30.2% in 2024, as Supply Chain Digest reported in its State of the Logistics Union analysis. Neither figure tells you what your warehouse charges.
Costs also move. The Logistics Managers' Index recorded an inventory-cost reading of 78.4 in May 2025, up from 75.6 in April, per the May 2025 LMI report. That's a pressure signal for your next insurance renewal and storage negotiation, not a rate to paste into a spreadsheet.
A carrying-cost rate is a planning parameter. Copy someone else's and you've also copied their warehouse lease, their insurance premium and their write-off history.
Why a cheap item can cost more to hold than an expensive one
| SKU | Average on-hand landed value | Carrying-cost rate | Annual carrying cost |
|---|---|---|---|
| $8 accessory, 800 units | $6,400 | 42% | $2,688 |
| $40 bestseller, 80 units | $3,200 | 18% | $576 |
The accessory costs a fifth as much per unit and nearly five times as much per year to hold. Its rate sits at 42% because a large minimum order forces 800 units, markdowns arrive every season, and the cash sits for months. The bestseller turns fast, so capital, storage and risk all shrink against a much smaller average balance.
That's the pattern to internalize: quantity and risk drive carrying dollars more often than unit price does. A lower purchase price does nothing for you if the SKU also brings a long lead time, a high minimum order and a markdown history. Use the published band only as a final sanity check on a rate you've already calculated, and when your number sits above it, trace which of the four buckets is responsible before you change a single order quantity. Set the rate beside the supply chain KPIs you already track, so a rising carrying cost shows up in the same view as fill rate and inventory turns.
Worked Example for a Shopify Bestseller
Say a kitchen gadget averages 400 units on hand across the year. Here is the full build, with every figure an illustration you can replace with your own.
Start with landed cost, not factory price
The factory quotes $12.00. Freight adds $1.50, duty and fees add $1.80, and inbound insurance adds $0.20, which gives a landed cost of $15.50 per unit. Landed cost combines factory price, freight, duty and other import costs into one per-unit number that gets recalculated as each bill arrives, because the first estimate is rarely the final one. Supply Automate's free landed cost calculator is built to produce that number before the order is placed, not after the container lands.
Average inventory value is 400 × $15.50 = $6,200, and the Shopify landed cost calculation walkthrough covers how each of those four inputs gets attributed to a single SKU.
Price each bucket for the same 12 months
Capital at a 12% hurdle comes to $744. Attributable 3PL storage, pick and pack for the year comes to $900. Insurance and inventory-related taxes come to $120. A 3% risk allowance for shrinkage and markdowns comes to $186. The four together are $1,950, which is $1,950 ÷ $6,200 = 31.5%.
| Line | How it is built | Annual cost |
|---|---|---|
| Landed cost per unit | $12.00 + $1.50 + $1.80 + $0.20 | $15.50 |
| Average inventory value | 400 units × $15.50 | $6,200 |
| Capital at 12% | $6,200 × 12% | $744 |
| Storage and handling | 3PL storage, pick and pack | $900 |
| Inventory service | Insurance and inventory-related taxes | $120 |
| Inventory risk | 3% of $6,200 for shrinkage and markdowns | $186 |
| Total annual carrying cost | Sum of the four buckets | $1,950 |
What 31.5% tells you to fix first
The rate translates into $162.50 a month, or $4.88 per unit per year. A 90-day hold on one unit therefore costs about $1.22, which belongs in the margin math for any promotion that keeps stock sitting past the quarter.
Set the result beside the 20% to 30% band and the diagnosis is in the largest line. Storage is $900, so ask whether the cubic footprint is too generous or the 3PL rate is above what the market charges before you blame the factory price. Capital is next at $744, which points at lead time and order quantity. Nothing in this build suggests the $15.50 landed cost is the problem.
Amazon FBA Storage and Aged-Inventory Charges
FBA moves the cost basis away from unit value and onto cubic feet and days. Amazon bills monthly storage on the daily average volume your properly packaged, ship-ready inventory occupies, and the charge varies by product type, size tier, time of year and storage-utilization ratio, as the Amazon FBA storage fee documentation sets out. A bulky low-price item can therefore cost far more to store than a small expensive one.

Storage follows cubic feet, not unit value
Say 100 standard-size units occupy 20 cubic feet. The monthly storage component is priced from that 20-cubic-foot average footprint, and a storage-utilization surcharge can apply to inventory held more than 30 days. Notice how different this is from a percentage of inventory value. Two SKUs at the same landed cost can generate storage charges that differ by a factor of four, purely because one ships in a bigger box.
Aging bands that add real dollars
Amazon adds an aged-inventory surcharge on top of ordinary storage once inventory has sat in fulfillment centers for 181 days or more, and the assessment uses an inventory snapshot taken on the 15th of each month. The U.S. aged-inventory surcharge rate table starts at $0.50 per cubic foot for 181 to 210 days and climbs steeply from there.
| Age in fulfillment centers | Surcharge rate | Example: 500 units, 40 cubic feet |
|---|---|---|
| 181–210 days | $0.50 per cubic foot | $20 |
| 211–240 days | $1.00 per cubic foot | $40 |
| 241–270 days | $1.50 per cubic foot | $60 |
| 366–455 days | $6.90 per cubic foot or $0.30 per unit, whichever is greater | $276 |
| 456 days or more | $7.90 per cubic foot or $0.35 per unit, whichever is greater | $316 |
At 456 days, 500 units occupying 40 cubic feet face the greater of $316 ($7.90 × 40) or $175 ($0.35 × 500), so $316 before ordinary storage fees. That's the same stock, the same shelf, and sixteen times the surcharge it faced at six months.
Capital runs in parallel. If a SKU holds $12,000 of landed inventory at a 12% annual rate and sits unsold for 90 days, the capital component alone is roughly $355 ($12,000 × 12% × 90/365), before storage, insurance or markdown risk, as the FBA fee and inventory guidance illustrates. Add the lines and the SKU-level formula becomes financing on landed value + monthly storage + aged surcharge + insurance + expected shrinkage and obsolescence.
Ordinary storage is typically billed between the 7th and 15th of the following month, and aged-inventory surcharges between the 18th and 22nd, which means a bad aging month shows up in two separate cash hits. Pull the fee report by SKU and age while stock is still under 181 days, when markdowns are a choice rather than a rescue, and the Amazon FBA inventory management playbook shows which report answers which question.
The video below works through how these fee layers stack on a seller's account.
A free tool helps here too. Supply Automate's Amazon Profit Calculator models FBA profit, margin, ROI and break-even ACoS after every major cost, so the carrying dollars from this build land in the same model as the referral fee.
Decide the Reorder Quantity and Clearance Action
The largest line in the build decides the action. Not the blended rate, not the benchmark you read last week. Work down the buckets from biggest to smallest and match each one to a lever.
- Rate above your company average, or above 20% to 30%: cut the reorder quantity or renegotiate the minimum order. The reorder point formula for importers shows how to tie the new quantity to lead time rather than to a supplier's carton break.
- Capital dominating: shorten lead time or split shipments so less landed value sits on hand at once. Paying a little more per unit for a faster, smaller run often costs less than financing four months of stock.
- Storage dominating: shrink the cubic footprint with better packaging, or move slower units to a cheaper storage tier before the next inbound.
- Amazon stock heading for 181 days before the 15th snapshot: markdown or remove it before that date. The surcharge you avoid is cash; the margin you give up is a forecast.
- Risk dominating: cut exposure to slow sellers before the next purchase order, not after the season ends.
Long production runs make this decision heavier. Apparel brands feel it hardest, because fabric commitments lock in carrying cost months before the first unit sells, and Genpire's guide to plan production runs for apparel covers how to phase those commitments against sell-through.
The check to run this week
Confirm landed cost per unit for your top SKUs. Confirm average inventory value across 12 rolling months. Recalculate the rate for each of those SKUs and compare it against the reorder point you're currently using. Then reorder only where the resulting carrying dollars still leave room for the margin you need, and track whether the decision paid off across a month of real orders with Supply Automate's free Excel P&L template.
Sequence matters: recalculate your three highest-value SKUs first. A defensible rate on 80% of your inventory value beats a perfect rate you never finish building.
Refresh the whole calculation each quarter, or the moment financing, warehouse pricing or sell-through shifts. A rate built last January describes a business that no longer exists.
The formula only works when the inputs are real, and the hardest input to get right is landed cost per unit. Supply Automate keeps supplier prices, freight, duty and fulfillment on a single purchase order record, so average inventory value comes from actual landed cost rather than a spreadsheet guess, and its Exact Landed Cost Engine delivers SKU-level costs before goods arrive. Upload one supplier invoice during the 30-day free trial and see what your units cost in about ninety seconds, with plans at $99 per month and no IT setup. Visit Supply Automate to see how it fits a Shopify or FBA operation.