The cheapest quote is often the most expensive supply. In 2025, 84% of procurement leaders classified as digital-investment leaders met or exceeded their supplier-performance plans, compared with 59% of less advanced organizations, according to Deloitte's 2025 Global Chief Procurement Officer Survey. The gap isn't a fancier spreadsheet. It's a score that follows cash, margin, and stock, and that refuses to look precise when the records aren't there.
A supplier scorecard template built for Amazon FBA and Shopify brands should score risk-adjusted landed margin per SKU, not unit price. Missing inspections, thin order history, and undisclosed subcontractors stay labeled Not enough data. They don't get converted into a tidy number that hides the hole.
Supplier Scorecard Template at a Glance
Copy these six rows before the next reorder. Weights total 100. Each row needs a record, not a feeling.
| Criterion | Weight (%) | Example target | Evidence source |
|---|---|---|---|
| Quality | 25 | Defect rate under 2% of inspected units | Inspection reports and receiving notes |
| Delivery | 20 | 95% of POs received on or before the confirmed date | PO dates and receipt dates |
| Landed cost | 20 | Within 3% of the estimated landed cost per SKU | Freight, duty and broker invoices |
| Documents and compliance | 15 | 100% of invoices complete | Commercial invoices and certificates |
| Responsiveness | 10 | First reply within 24 hours; issues closed within 2 business days | Message thread and issue log |
| Resilience | 10 | Qualified second source; all subcontractors disclosed | Supplier declarations and audit records |
| Total | 100 | Weighted score from 0 to 100 | Sum of weighted criterion scores |
Weights follow what hits cash, margin, and inventory risk, so quality and landed cost lead. Every row rests on something you can open later, such as an inspection report, a purchase-order date, or an invoice.
The same six rows work whether stock ships to an Amazon fulfillment center or into a Shopify warehouse. Only the evidence changes. FBA teams lean on commercial invoices, carton counts, and pre-shipment inspections. Shopify teams lean on transfer status and receiving notes.
Companies with formal supplier-performance measurement improved supplier performance by an average of 26.6%, yet 72% of respondents said their organizations measured fewer than half of their suppliers, according to a widely cited global benchmarking study on supplier performance management. Fill quality and delivery first. Those numbers already sit in inspection notes and PO dates. Each formula is defined next.
Evaluation Criteria and Formulas for Each Score
Lock the formula, the floor, and the evidence before anyone scores a factory. CIPS guidance on supplier performance says targets belong in the contract, and that objective records such as lead times and pricing compliance should sit beside stakeholder feedback, not inside a procurement-only rating.
Convert each result to a 0 to 100 score on a straight line that sets 100 at the target and 0 at a stated floor. With a 2% defect target and a 10% floor, a 2% rate scores 100 and a 6% rate scores 50. Store the numerator, the denominator, the reporting period, and an evidence link on every row. Broader metric design sits in this guide to supply chain KPIs.
| Criterion | Formula | Worked example | Evidence |
|---|---|---|---|
| Quality | Defective units divided by units inspected | 12 defects in 600 units = 2.0% | Inspection report |
| Delivery | POs received on time divided by completed POs | 19 of 20 on time = 95% | PO and receipt dates |
| Landed cost | (Actual minus estimated landed cost) divided by estimate | $4.10 estimate, $4.23 actual = 3.2% variance | Freight, duty and broker invoices |
| Documents and compliance | Complete invoices divided by invoices issued | 18 of 20 complete = 90% | Commercial invoices and certificates |
| Responsiveness | Median hours to first reply; days to close an issue | Median first reply 18 hours; issues closed in 1.5 business days | Message thread and issue log |
| Resilience | Qualified alternates, disclosed subcontractors, current certificates | One qualified alternate, subcontractors named, certificates current | Supplier declarations and audit records |
Quality is defective units divided by units inspected. Twelve defects in 600 units is 2.0%, which meets a 2% target and scores 100 on that scale. For sewn goods, pair the count with a written defect list. A practical reference for compromise-free branded apparel quality shows why a pass rate without a defect definition doesn't travel between inspectors.
Delivery is purchase orders received on or before the confirmed date, divided by completed POs. Nineteen of 20 is 95%.
Landed cost is actual landed cost minus the estimate, divided by the estimate. Freight, duty, insurance, and broker fees all belong in both numbers. A unit estimated at $4.10 that lands at $4.23 is a 3.2% variance, just outside a 3% band.
Documents and compliance is complete invoices divided by invoices issued, checked for supplier contact details, product identifiers, and proof the transaction was fulfilled. Eighteen of 20 is 90%.
Responsiveness uses two clocks, median hours to the first reply and business days to close the issue. A median of 18 hours and a close in 1.5 days beats a 24-hour and 2-day target.
Resilience counts qualified alternates, whether subcontractors are named, and whether certificates are current. One named alternate with current certificates is a pass on the default target. Zero alternates is not rescued by a friendly account manager.
Practical rule: Don't publish a weighted total until minimum gates exist. A critical safety defect, missing regulatory paperwork, or a repeated miss of a contractual ship date escalates on its own.
Setting Weights and Score Bands
Start from quality 25, delivery 20, landed cost 20, documents 15, responsiveness 10, and resilience 10. Then move weight toward the SKU that can hurt you.
A safety-relevant or top-selling SKU can take quality to 30 and cut responsiveness to 5. A low-risk accessory keeps the default. Weights must total 100, and they get published before the first review so nobody edits them after seeing a bad total.
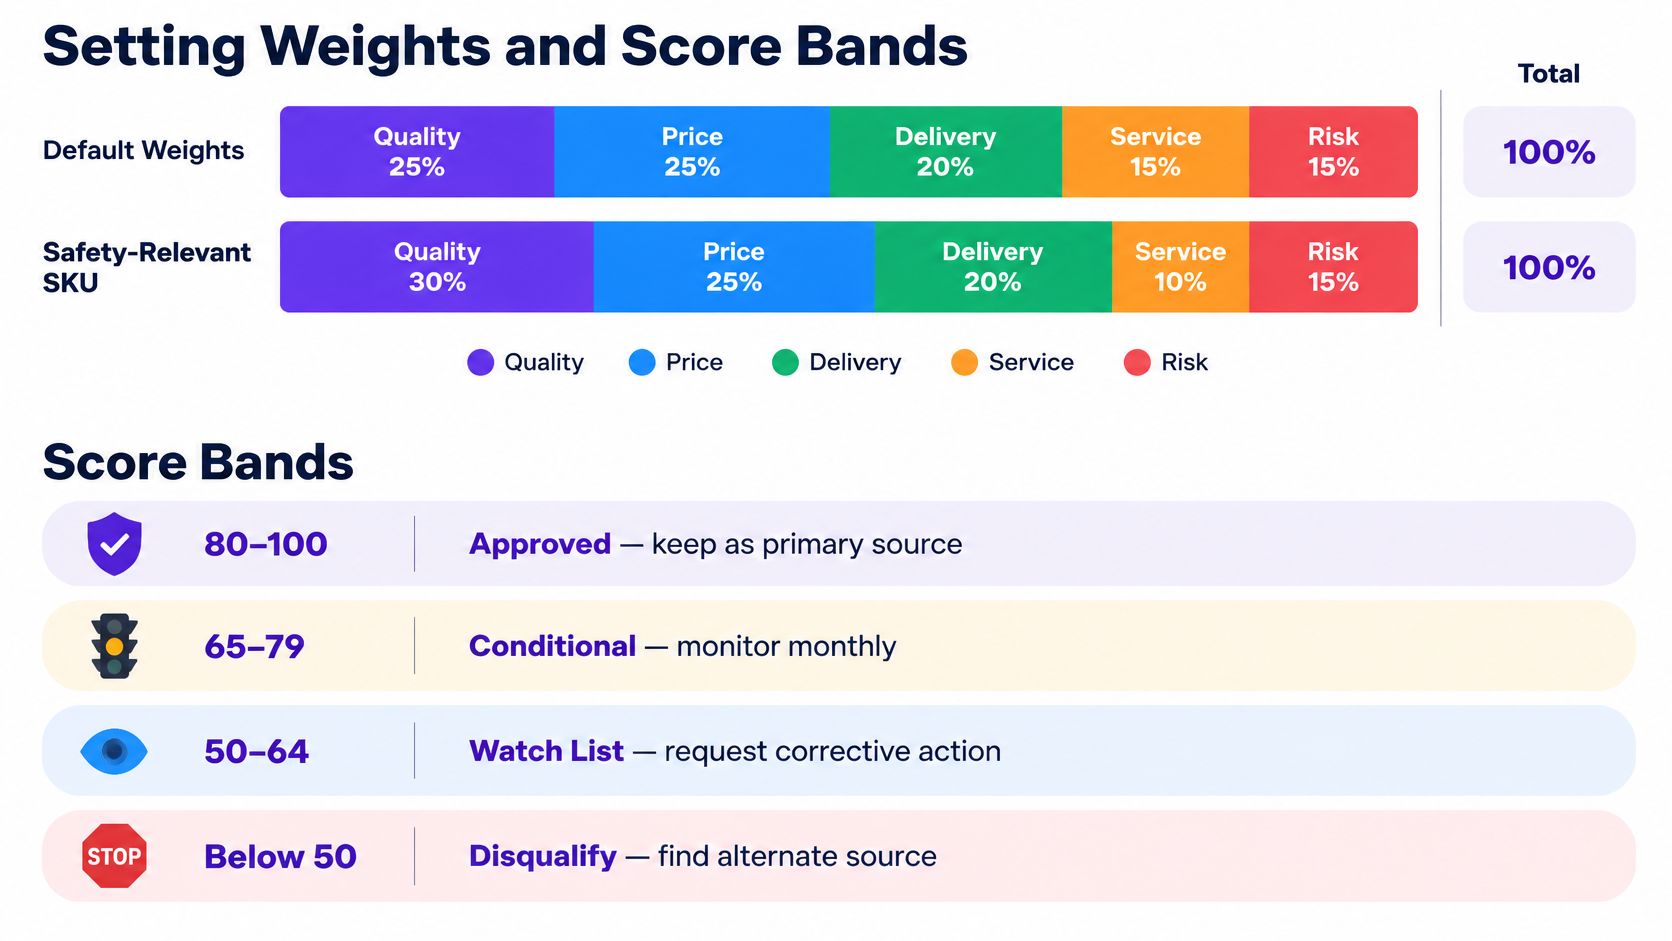
| Score range | Status | Required action |
|---|---|---|
| 90-100 | Preferred | Keep volume; review quarterly |
| 75-89 | Maintain | Monitor monthly; set one improvement goal |
| 60-74 | Watch | Written action plan; re-score in 30 days |
| Below 60 | Corrective action | Hold new POs until the plan is verified |
| No score | Not enough data | Collect evidence; escalate critical unknowns |
Gates that override the total
Four events cap the supplier at Watch no matter how strong the commercial math looks.
- Critical safety defect: Stop new production on that SKU until the lot is contained.
- Missed regulatory documentation: Treat the file as incomplete until the certificate is in hand.
- Three consecutive late POs against a contractual date: The pattern beats any single on-time average.
- Undisclosed subcontractor handling the product: Disclosure comes before the next PO.
ISO-aligned supplier control asks for criteria that match the supplier's impact and risk, and for evaluation results that are kept as evidence, which is the point of ISO 9001 supplier evaluation practice. Run monthly operational monitoring and a quarterly business review. Suppliers without enough evidence stay at Not enough data rather than receiving a guessed score.
Scoring Suppliers with Missing or Thin Data
Say a factory has three POs, one inspection of 120 units, and no subcontractor list. Delivery and quality both read Not enough data, since neither meets its sample floor, and the open request for the subcontractor list blocks Preferred until that list arrives. I would not publish a quality score of 72 on that sample.
Hard floors decide whether a cell may show a number at all.
- Delivery: At least five completed POs. Three POs stay Not enough data.
- Quality: At least three inspections or 300 inspected units. One inspection of 120 units fails that floor.
- Source type: Mark each metric as PO records, an inspection report, or supplier self-reporting.
- Confidence: Put High, Medium, or Low beside a score that cleared the floor. Self-reported figures stay Low until a receiving record checks them.
A McKinsey supply chain risk survey found that 95% of organizations report visibility into tier-one supplier risks, while only 42% can see tier-two risks or beyond. A factory can hit its own ship date while an unnamed material supplier creates the exposure. Put the dependency questions into supplier onboarding so the gap shows up before the third reorder.
An undisclosed subcontractor on a safety-relevant component triggers escalation and a dated information request. Record the request and leave the score blank.
The same rule protects risk-adjusted landed margin per SKU. Missing freight, duty, or inspection evidence stays Not enough data. A unit price beside a blank cost file cannot stand in for margin.
Three Factories Scored Side by Side
Three factories quoted the same SKU for a 500-unit reorder. The scores below are illustrative. Replace them with your own numerators.
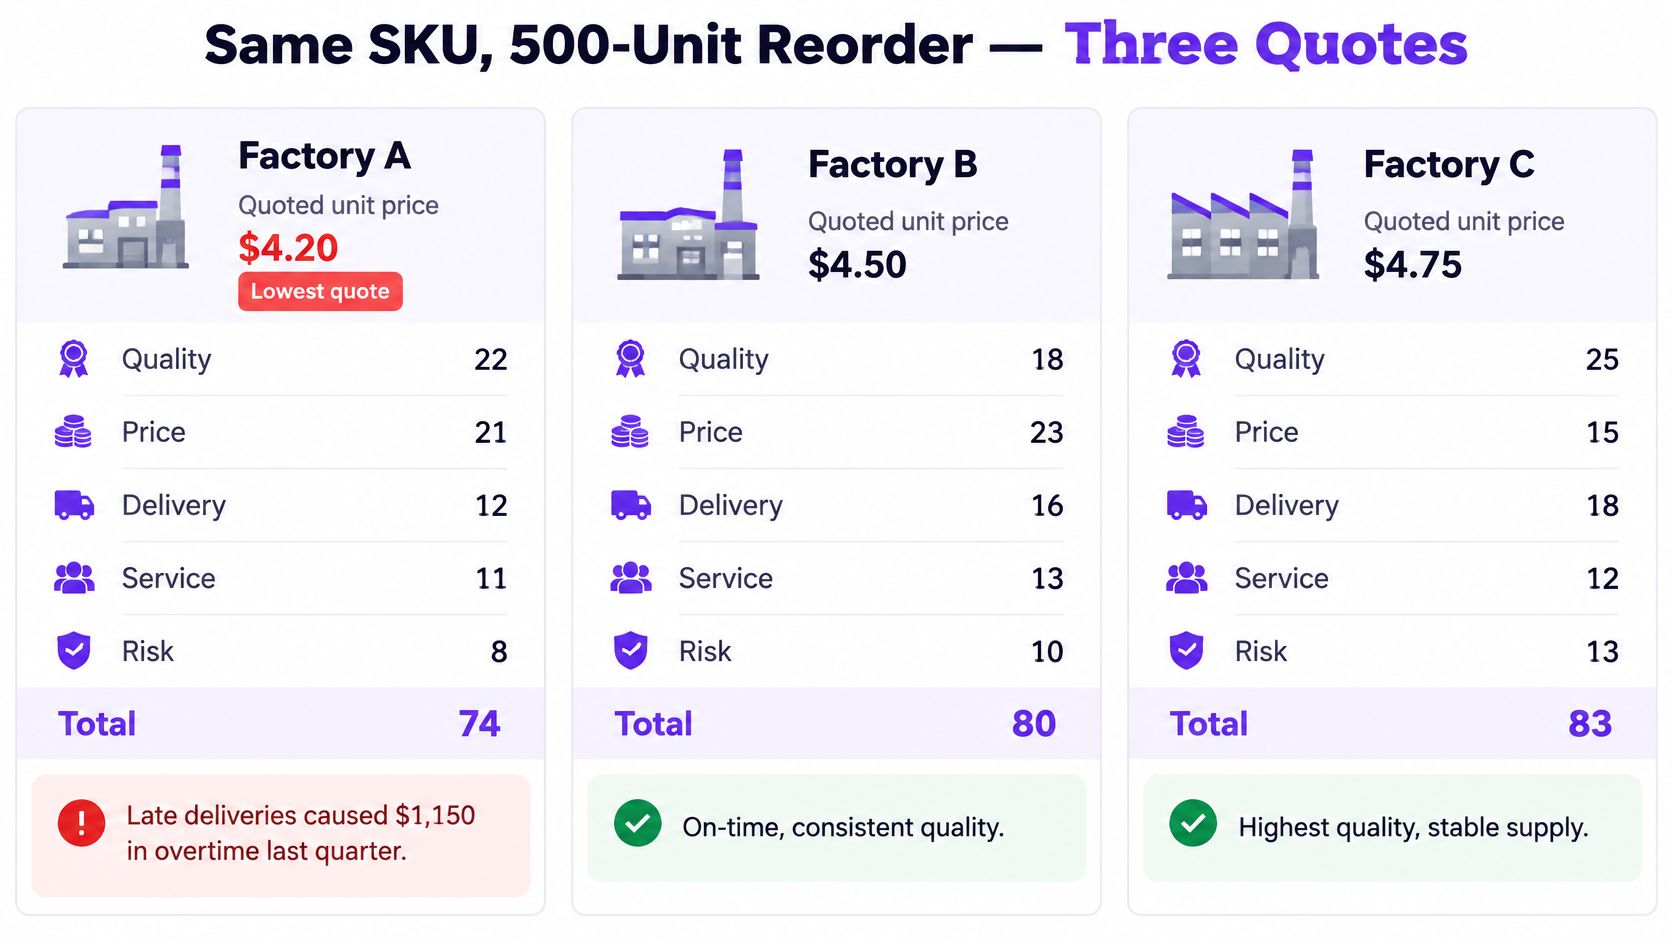
Default weights apply. Factory A's arithmetic, in full:
0.25 × 78 + 0.20 × 70 + 0.20 × 65 + 0.15 × 60 + 0.10 × 85 + 0.10 × 60 = 70.0, which is Watch.
| Factory | Quality | Delivery | Landed cost | Documents | Responsiveness | Resilience | Total | Status |
|---|---|---|---|---|---|---|---|---|
| A, lowest quote | 78 | 70 | 65 | 60 | 85 | 60 | 70.0 | Watch |
| B, highest quote | 92 | 90 | 80 | 95 | 75 | 70 | 85.8 | Maintain |
| C, middle quote | 88 | 84 | 86 | 70 | 90 | 85 | 84.0 | Maintain |
Factory B's total is 0.25 × 92 + 0.20 × 90 + 0.20 × 80 + 0.15 × 95 + 0.10 × 75 + 0.10 × 70 = 85.8. Factory C lands at 84.0.
What the low quote hid
Factory A's landed-cost score of 65 is the tell. Expedited freight and a longer lead time, once duty and delays are in the file, made the cheapest quote the weaker supply. The other drags are documents and resilience at 60 for A, resilience at 70 and responsiveness at 75 for B, and documents at 70 for C. A pre-shipment inspection checklist is what turns A's quality 78 from a vibe into a counted defect rate before you argue the score.
Factory B gets the next PO. Factory C is qualified as a second source once the document gaps close. Factory A stays on Watch with a dated plan for documents and delivery.
Amazon FBA Invoice Fields to Score
Take an FBA seller with 4 ASINs and 20 invoices. Eighteen carry every field the scorecard asks for, so completeness is 90%. One failure is a missing supplier phone number. The other is a bundle that omits a component. Fix both before a notification arrives.
Score the invoice as the control record for the replenishment. Appeals often turn on a fixed set of fields. I use this list as general practice:
Supplier identity is name, phone, address, and website. The issue date is clearly displayed and falls inside the review window the notice covers. Quantity cover is enough units for sales and in-stock inventory on each cited ASIN across that window. Identifiers (model number, UPC, EAN, or ISBN) match the listing. Variations state color or style. Bundles list every component. Transaction status reads completed and fulfilled, saved as a readable PDF or image.
Three scores come off that list. Invoice completeness is complete invoices divided by invoices issued. Identifier accuracy is matching listings divided by listings checked. Evidence readiness is whether the file can be pulled within one working day.
A 100% score means every invoice is complete and the quantities cover recent inventory and sales. Keep the files in one folder named by ASIN and date.
If supplier price, freight, or duty is blank, that SKU has no risk-adjusted landed margin. I mark it Not enough data. Do not fill the gap with the unit price and call the result a score. Documents carry 15 of the 100 weight points, so a thin invoice file still moves the total when the cartons look fine.
Shopify Receiving Fields and Discrepancy Rate
Receipt status is a score, not a checkbox. Shopify purchasing already holds the delivery evidence if you read the transfer instead of the supplier's tracking email.
A purchase order marked Ordered can generate an inventory transfer. Shopify's purchase order flow records shipment movement, receiving, and cost adjustments, with transfer statuses such as In progress and Received. The Received column is the unit count.
Measure on-time arrival as the date the transfer reaches Received, compared with the promised date. Score lateness on the first receipt date and completion on the final receipt date, so a split shipment is not punished twice.
One reorder, two dates
A supplier promises 2,000 units by June 1. On June 3 the transfer is still In progress and shows 1,500 received. Record a two-day delay, 75% receipt completion, and 500 units outstanding. That split is more useful than a single late flag.
Receiving accuracy is accepted units divided by PO units. Discrepancy rate tracks how often received quantities differ from the purchase order, and the adjustment history serves as the audit trail. Use this split:
Discrepancy rate = units rejected, missing, or inconsistent ÷ units expected, with reason codes for damage, shortage, incorrect SKU, and counting error.
If the expected quantity or the reason code is blank, write Not enough data. Do not convert a gap into a precise-looking percentage. A blank count is not a clean receipt.
On a later receipt of the same supplier, 500 units are expected and 500 arrive, but 8 damaged units are rejected. Accepted quantity is 492 of 500, or 98.4%. Discrepancy is 1.6%, coded as damage. The same count works for an FBA seller who checks factory quantities before forwarding cartons to Amazon. For sewn product, align those reason codes with inspection criteria for branded workwear so a damage code means the same thing at the factory and at the dock.
I treat those eight rejected units as a cost on that SKU, not only as a quality percentage. Unit price can match the PO while the usable quantity does not, and that gap is what changes the risk-adjusted margin.
Landed Margin and When to Pick a Second Source
Unit price is a bad proxy for what the SKU earns. Tariffs, freight, insurance, defects, and rush shipments can make the low bidder the costly one.

A 2025 manufacturing survey found that 61% of manufacturers viewed supply-chain disruption as a serious current challenge, while 49% reported longer production lead times, 44% higher costs passed to customers, and 43% reduced product availability. Continuity planning follows that pressure. Unstable suppliers and disrupted logistics are a reason to hold a second source, scored on margin, not on a cheaper unit price.
The score that matters is risk-adjusted landed margin per SKU. Build it the way a landed cost calculation for imported products splits freight, duty, and fees, then take off defect and rework dollars, days of cover lost while a PO is late, and the cash tied up when MOQ is multiplied by unit cost. A tariff or freight shock is the margin change on the selling price.
A 10% tariff increase that adds $0.60 to a $6.00 landed unit cuts margin by about 4 points on a $15 sale. If duty, freight, or defect dollars are missing, write Not enough data. A blank is more honest than a score that looks exact.
Score resilience apart from historical on-time delivery, and weight the supplier by how critical that SKU is. A higher-cost second source is justified when its risk-adjusted contribution margin per unit, after the stockout cost of the primary's late POs, is higher. A primary at a 35% margin, with one PO in four running three weeks late, can lose more than a second source that costs 3% more.
I would switch volume only when both margins rest on complete cost records. The question the scorecard should answer is which supplier produces the best risk-adjusted margin for this SKU.
Monthly and Quarterly Review Checklist
Run the same routine on a calendar, not when a late container forces the conversation. A tool that can flag late shipments early only helps if someone still opens the scorecard in week one.
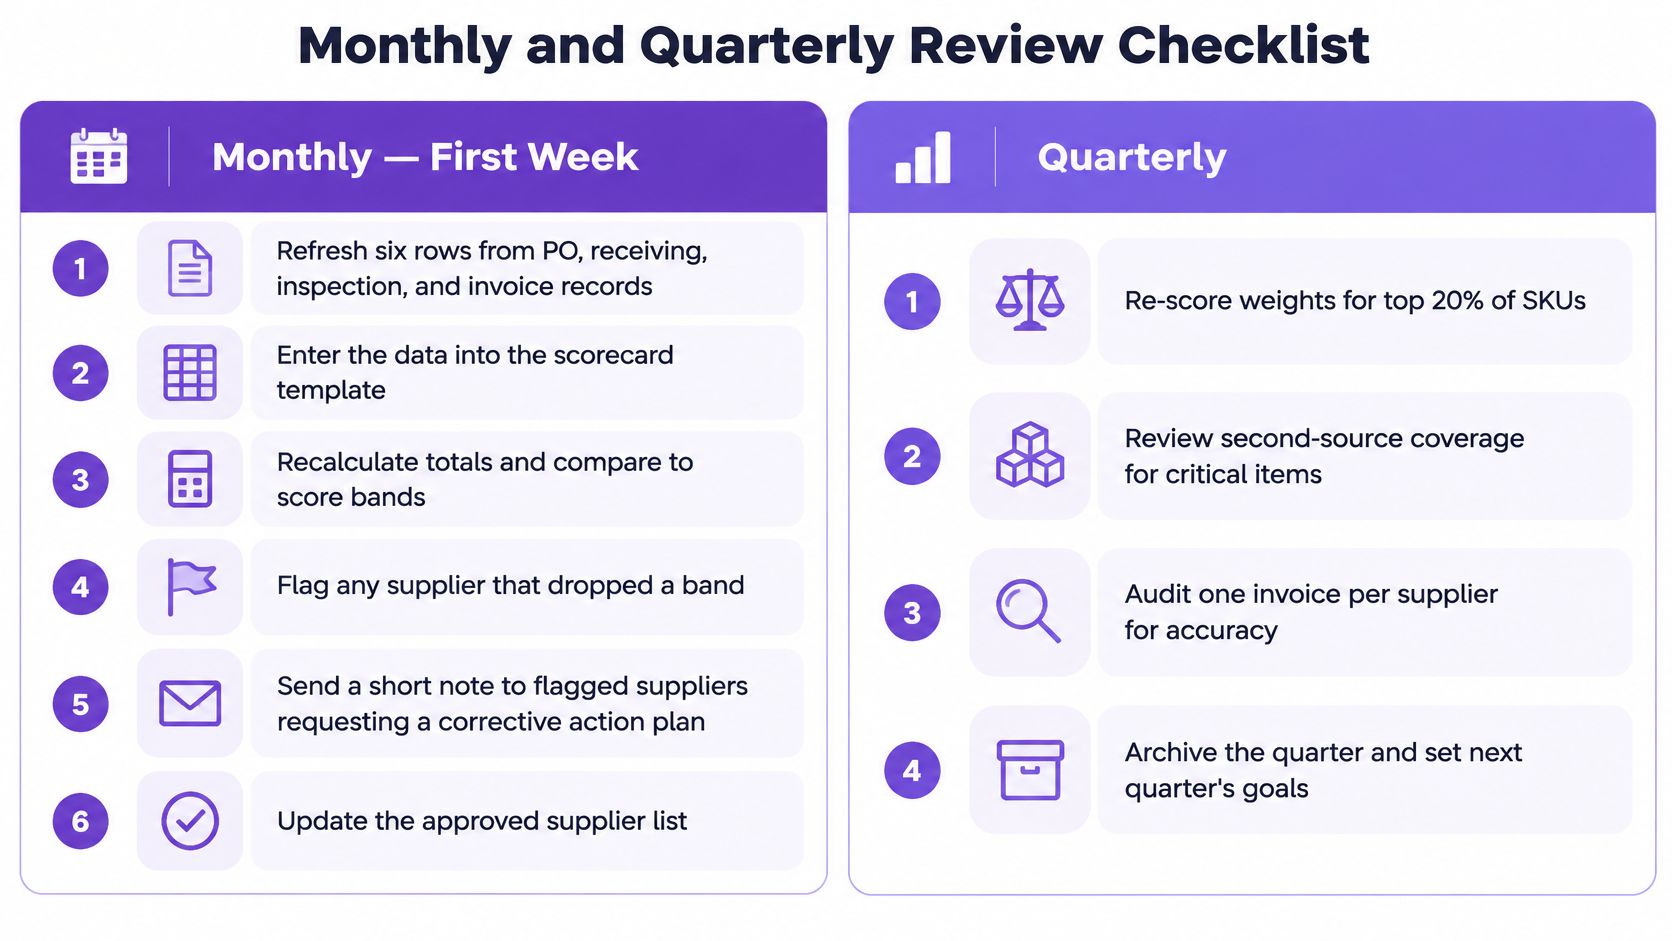
Monthly, inside the first week
- Refresh the six rows from PO, receiving, inspection, and invoice records.
- Enter numerator, denominator, and evidence link for each metric that cleared its sample floor.
- Check every gate before you trust the weighted total.
- Confirm a dated action plan and an owner for every Watch or Corrective action supplier.
- Mark Not enough data and its confidence level anywhere the sample is still thin.
Quarterly
- Revisit weights against current SKU criticality, and publish any change before the next scores.
- Check that the bands still match the targets you are willing to buy against.
- Compare three months of trend, not the latest shipment.
- Decide keep, second-source, or stop new POs, and score any second source on the same rules.
- Archive the evaluation evidence so a later audit isn't a scavenger hunt.
If a supplier fails the same gate in two consecutive quarters, the item stops being a review topic and becomes a sourcing decision.
Set Up Your Scorecard and Score Your Top Suppliers
Three suppliers, scored on risk-adjusted landed margin per SKU, is enough to name who gets the next PO. Unit price is the wrong tie-breaker. I leave a thin sample as Not enough data. I do not turn a missing inspection rate into a precise-looking score.
- List every supplier that ships to Amazon FBA or into the Shopify warehouse, and pick the three with the highest order value.
- Fill quality and delivery first from inspection notes and PO dates, using the formulas already set. Then enter landed cost so margin, not the quote, drives the rank.
- Publish the weights and gates, then score the three. Any metric under its sample floor stays Not enough data.
- Book the first monthly review within 30 days.
Free downloads cover the paperwork behind those rows. SupplyAutomate offers a purchase order template, packing list, commercial invoice, supplier evaluation matrix, inventory tracking template, landed cost spreadsheet, lead time tracker, RFQ template, and proforma invoice template. Purchase orders, supplier communications, shipping invoices, and landed-cost reports can be exported to CSV or Excel at any time, so the scorecard can be rebuilt from source files instead of from memory. Brands comparing candle programs can use the same evidence habit while reading up on wholesale candle sourcing in Canada.
Name the supplier that gets the next PO. Name the one that stays on Watch until the action plan is checked against the records.
Supply Automate gives ecommerce brands one workspace for supplier threads, purchase orders, and SKU-level landed cost, which is the evidence a supplier scorecard template needs before the next reorder. The free supplier evaluation matrix is a direct way to weight criteria and rank factories without building the sheet from scratch. Visit Supply Automate to start the scorecard from records you already have.